
We extend our deepest condolences to those who lost their lives in the recent flood and debris flow near the Nepal–China border, and we offer our heartfelt sympathies to the bereaved families and all those affected.
On August 26, 2026, a large‑scale flood and debris flow occurred in the steep mountain terrain of the Himalayas close to the Nepal–China border. It is believed that extensive sediment movement took place across a wide area.
At Asia Air Survey Co., Ltd., we conducted terrain and satellite‑image analyses—using publicly available elevation data and satellite imagery—to characterize the topography and quantify sediment displacement in the disaster‑affected region.
We hope our technical findings will aid in local investigations and help mitigate secondary disasters.
Red Relief Image Maps
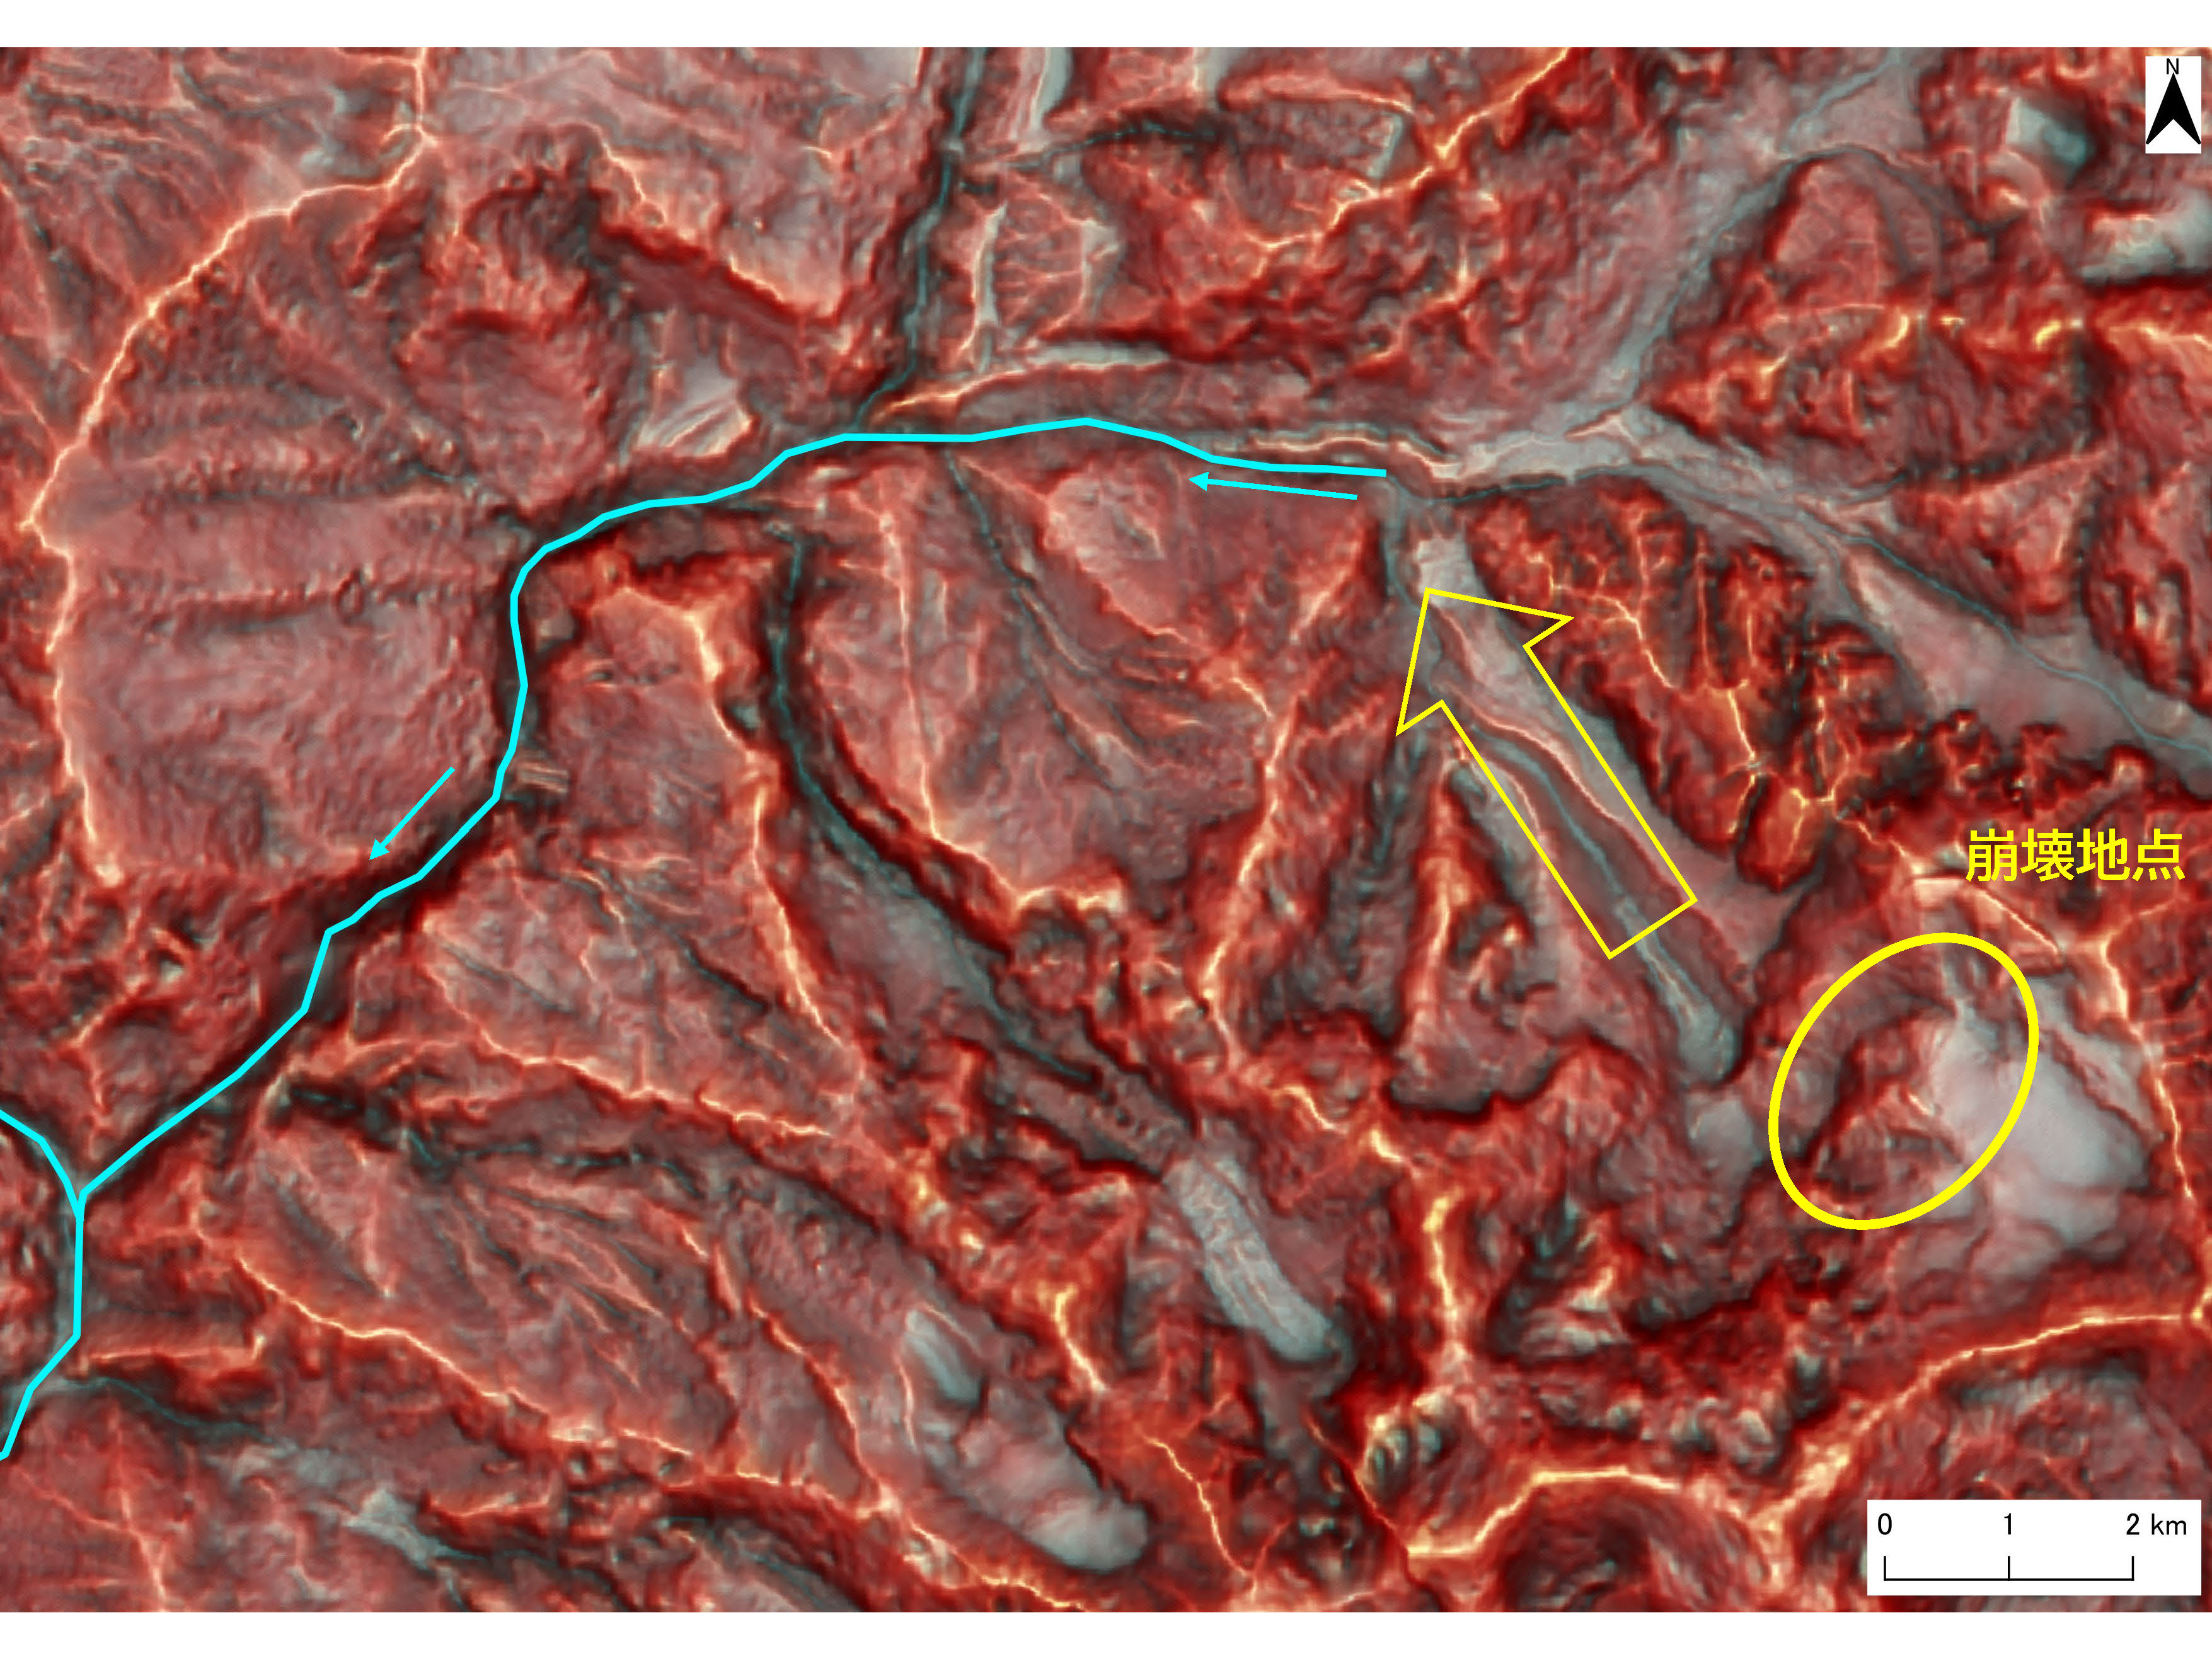
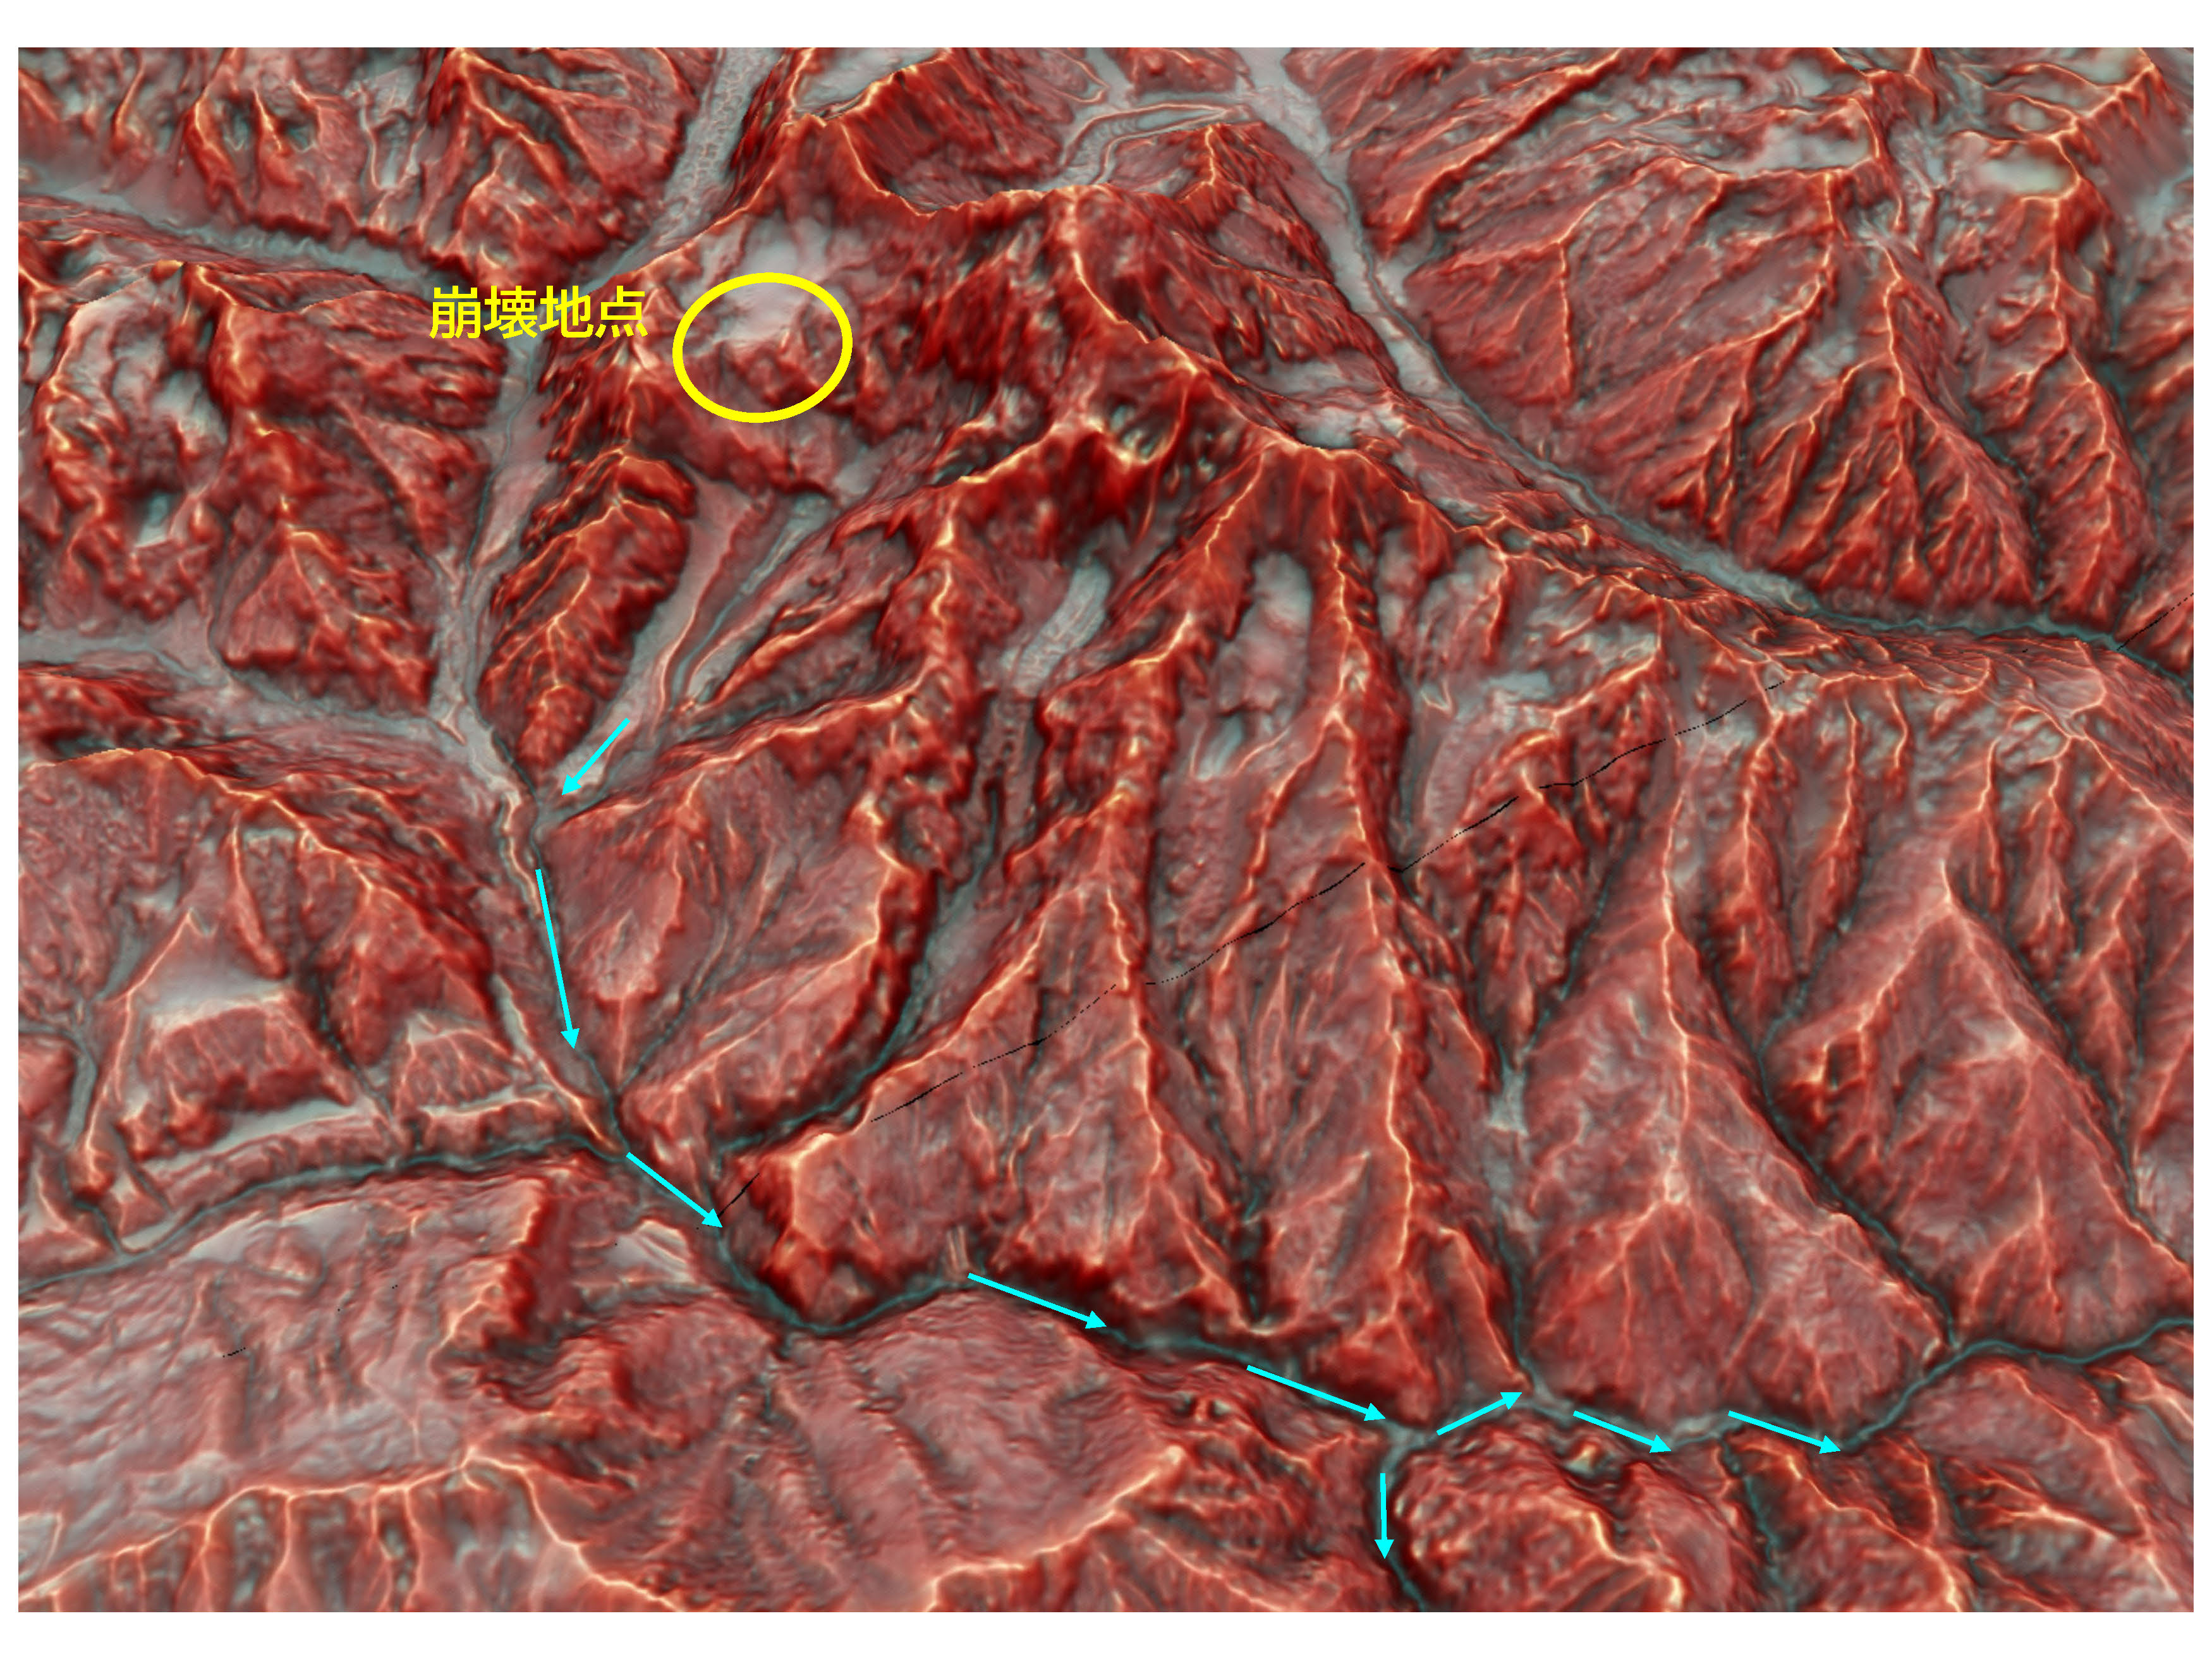
Using publicly available elevation data, we have generated Red Relief Image Maps of the disaster‑affected area and are also providing KMZ files with geolocation. Please note that these maps are based on pre‑disaster data.
The shaded boundary of sediment flow was approximately interpreted from optical imagery captured by ESA’s Sentinel‑2 Earth observation satellite.
Yellow circle: Collapse point
Light blue line: Flow extent
○ Location Map
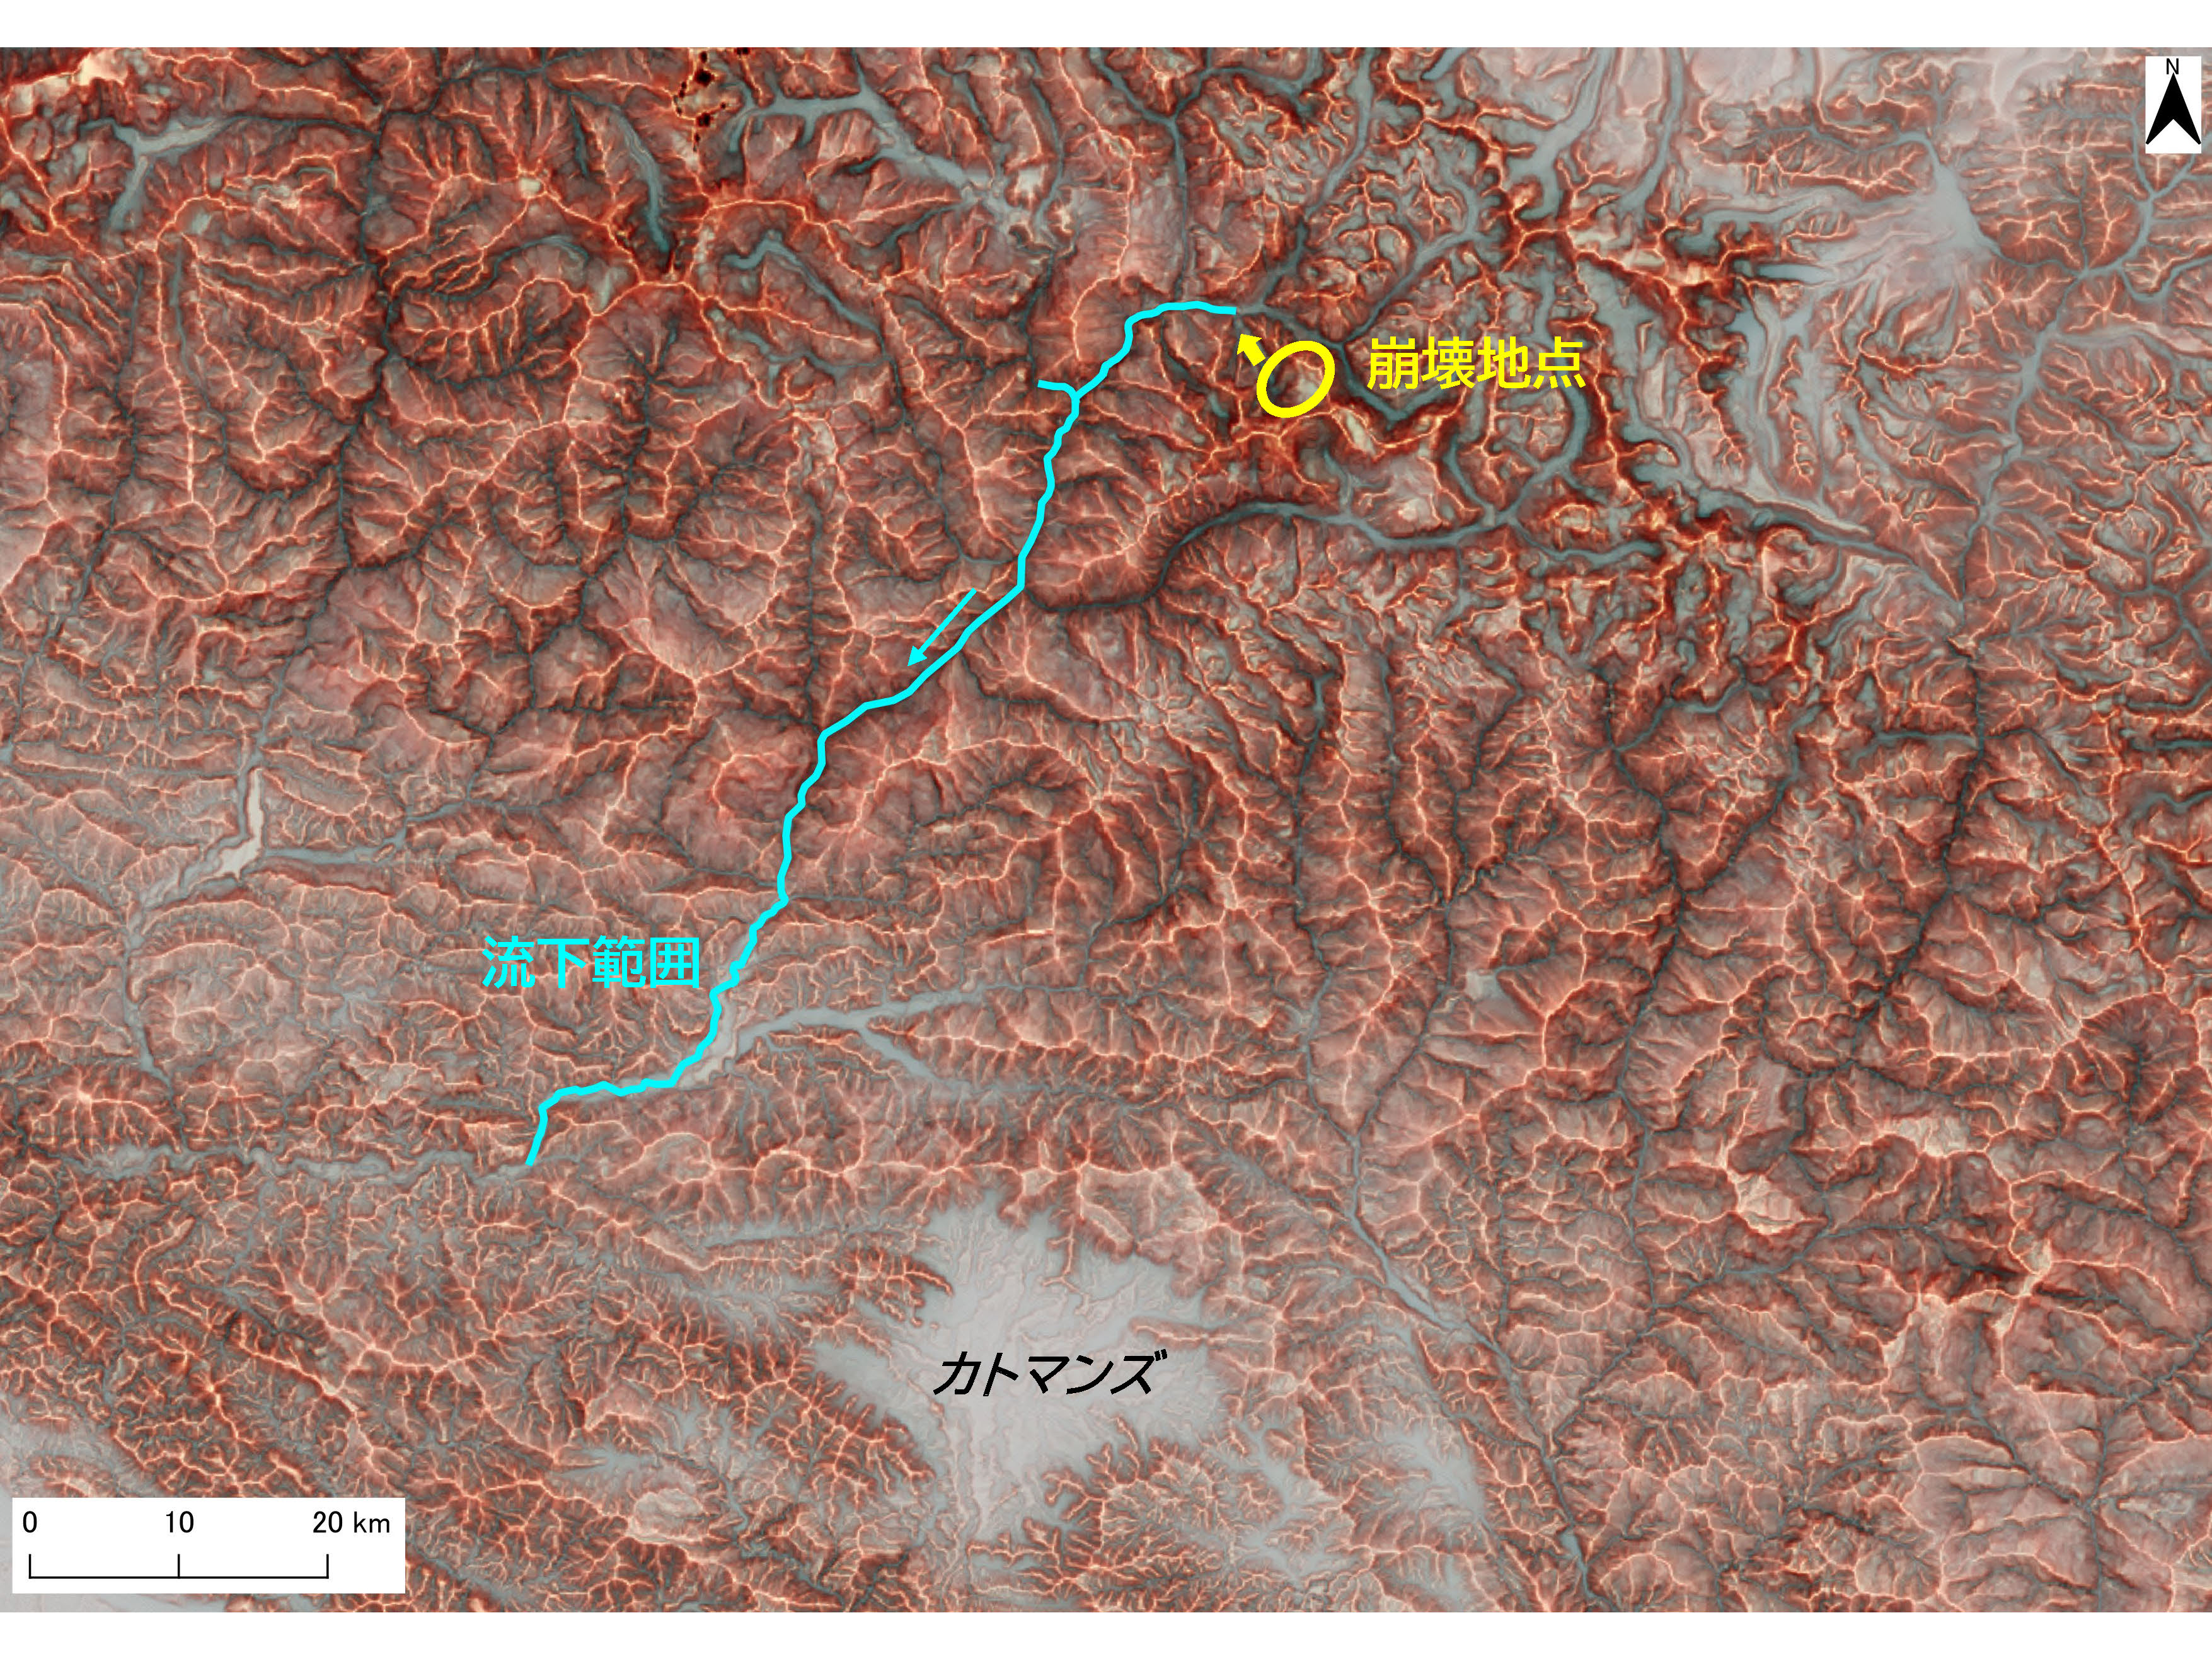 The Red Relief Image Maps were produced with Mapterhorn (https://mapterhorn.com/).
○ Red Relief Image Map (Plan View: Surroundings of the Collapse Site)
○ Red Relief Image Map (Oblique View: Surroundings of the Collapse Site)
○ Comparison Video of Pre‑Collapse Red Relief Image Map and Satellite Imagery
A video has been prepared to compare pre‑collapse satellite images with the Red Relief Image Map. Satellite imagery can suffer from shadowing—due to terrain angles or sun elevation—making detailed topographic interpretation difficult. In contrast, the Red Relief Image Map clearly reveals terrain features, including shaded regions.
○ Red Relief Image Map (KMZ Data)
Regional Overview KMZ: 37 MB (File: Nepal_RRIM_L.kmz)
Local Collapse‑Site KMZ: 30 MB (File:Nepal_RRIM_s.kmz)
| ■ Revision History |
| ■ About This Page |
|
[Contact Information] When sending inquiries by e‑mail, please agree to our Privacy Policy (https://www.ajiko.co.jp/privacy) For Media Inquiries
Asia Air Survey Co., Ltd. – Corporate Planning Dept.
E-mail:service@ajiko.co.jp For Government, Research Institutions, and Corporate Clients
Asia Air Survey Co., Ltd. – Sales & Marketing Division
E-mail:service@ajiko.co.jp |
| ■ Secondary Use of Red Relief Image Maps |
|
Please review the usage terms at the following site and complete the online registration at the bottom of the page: Red Relief Image Map Site – https://www.rrim.jp/researcher/ |
| ■ Copyright Notice |
|
All text and images on this page are the property of Asia Air Survey Co., Ltd. or other credited rights holders. No part of these materials may be reproduced, sold, published, or otherwise distributed without prior permission. |
| ■ Disclaimer |
|
While we have exercised due care in preparing this page and strive for accuracy, Asia Air Survey Co., Ltd. assumes no responsibility for the completeness or correctness of its contents. Should you discover any clear errors, please contact us for correction or removal. |