The first report is available on this page.
high-resolution Red Relief Image Maps [2m DEM, as of 2019]
Using the publicly released pre-event high-resolution elevation data, we created Red Relief Image Maps of the disaster-affected area. KMZ data with geolocation is also provided. Please note that these Red Relief Image Maps represent pre-event conditions.
・Data Used (created with the author’s permission)
Berthier, E. (2026). 13 October 2019 Pléiades (CNES) pre-event Digital Elevation Models (DEMs) for the rock-ice avalanche source area of the August 2026 Trishuli catastrophic flood [Dataset]. Zenodo. https://doi.org/10.5281/zenodo.22147118
○ Red Relief Image Map (Plan View: Surroundings of the Collapse Site)
Left: Red Relief Image Map
Right: Red Relief Image Map with elevation and contour lines (1,000 m intervals)
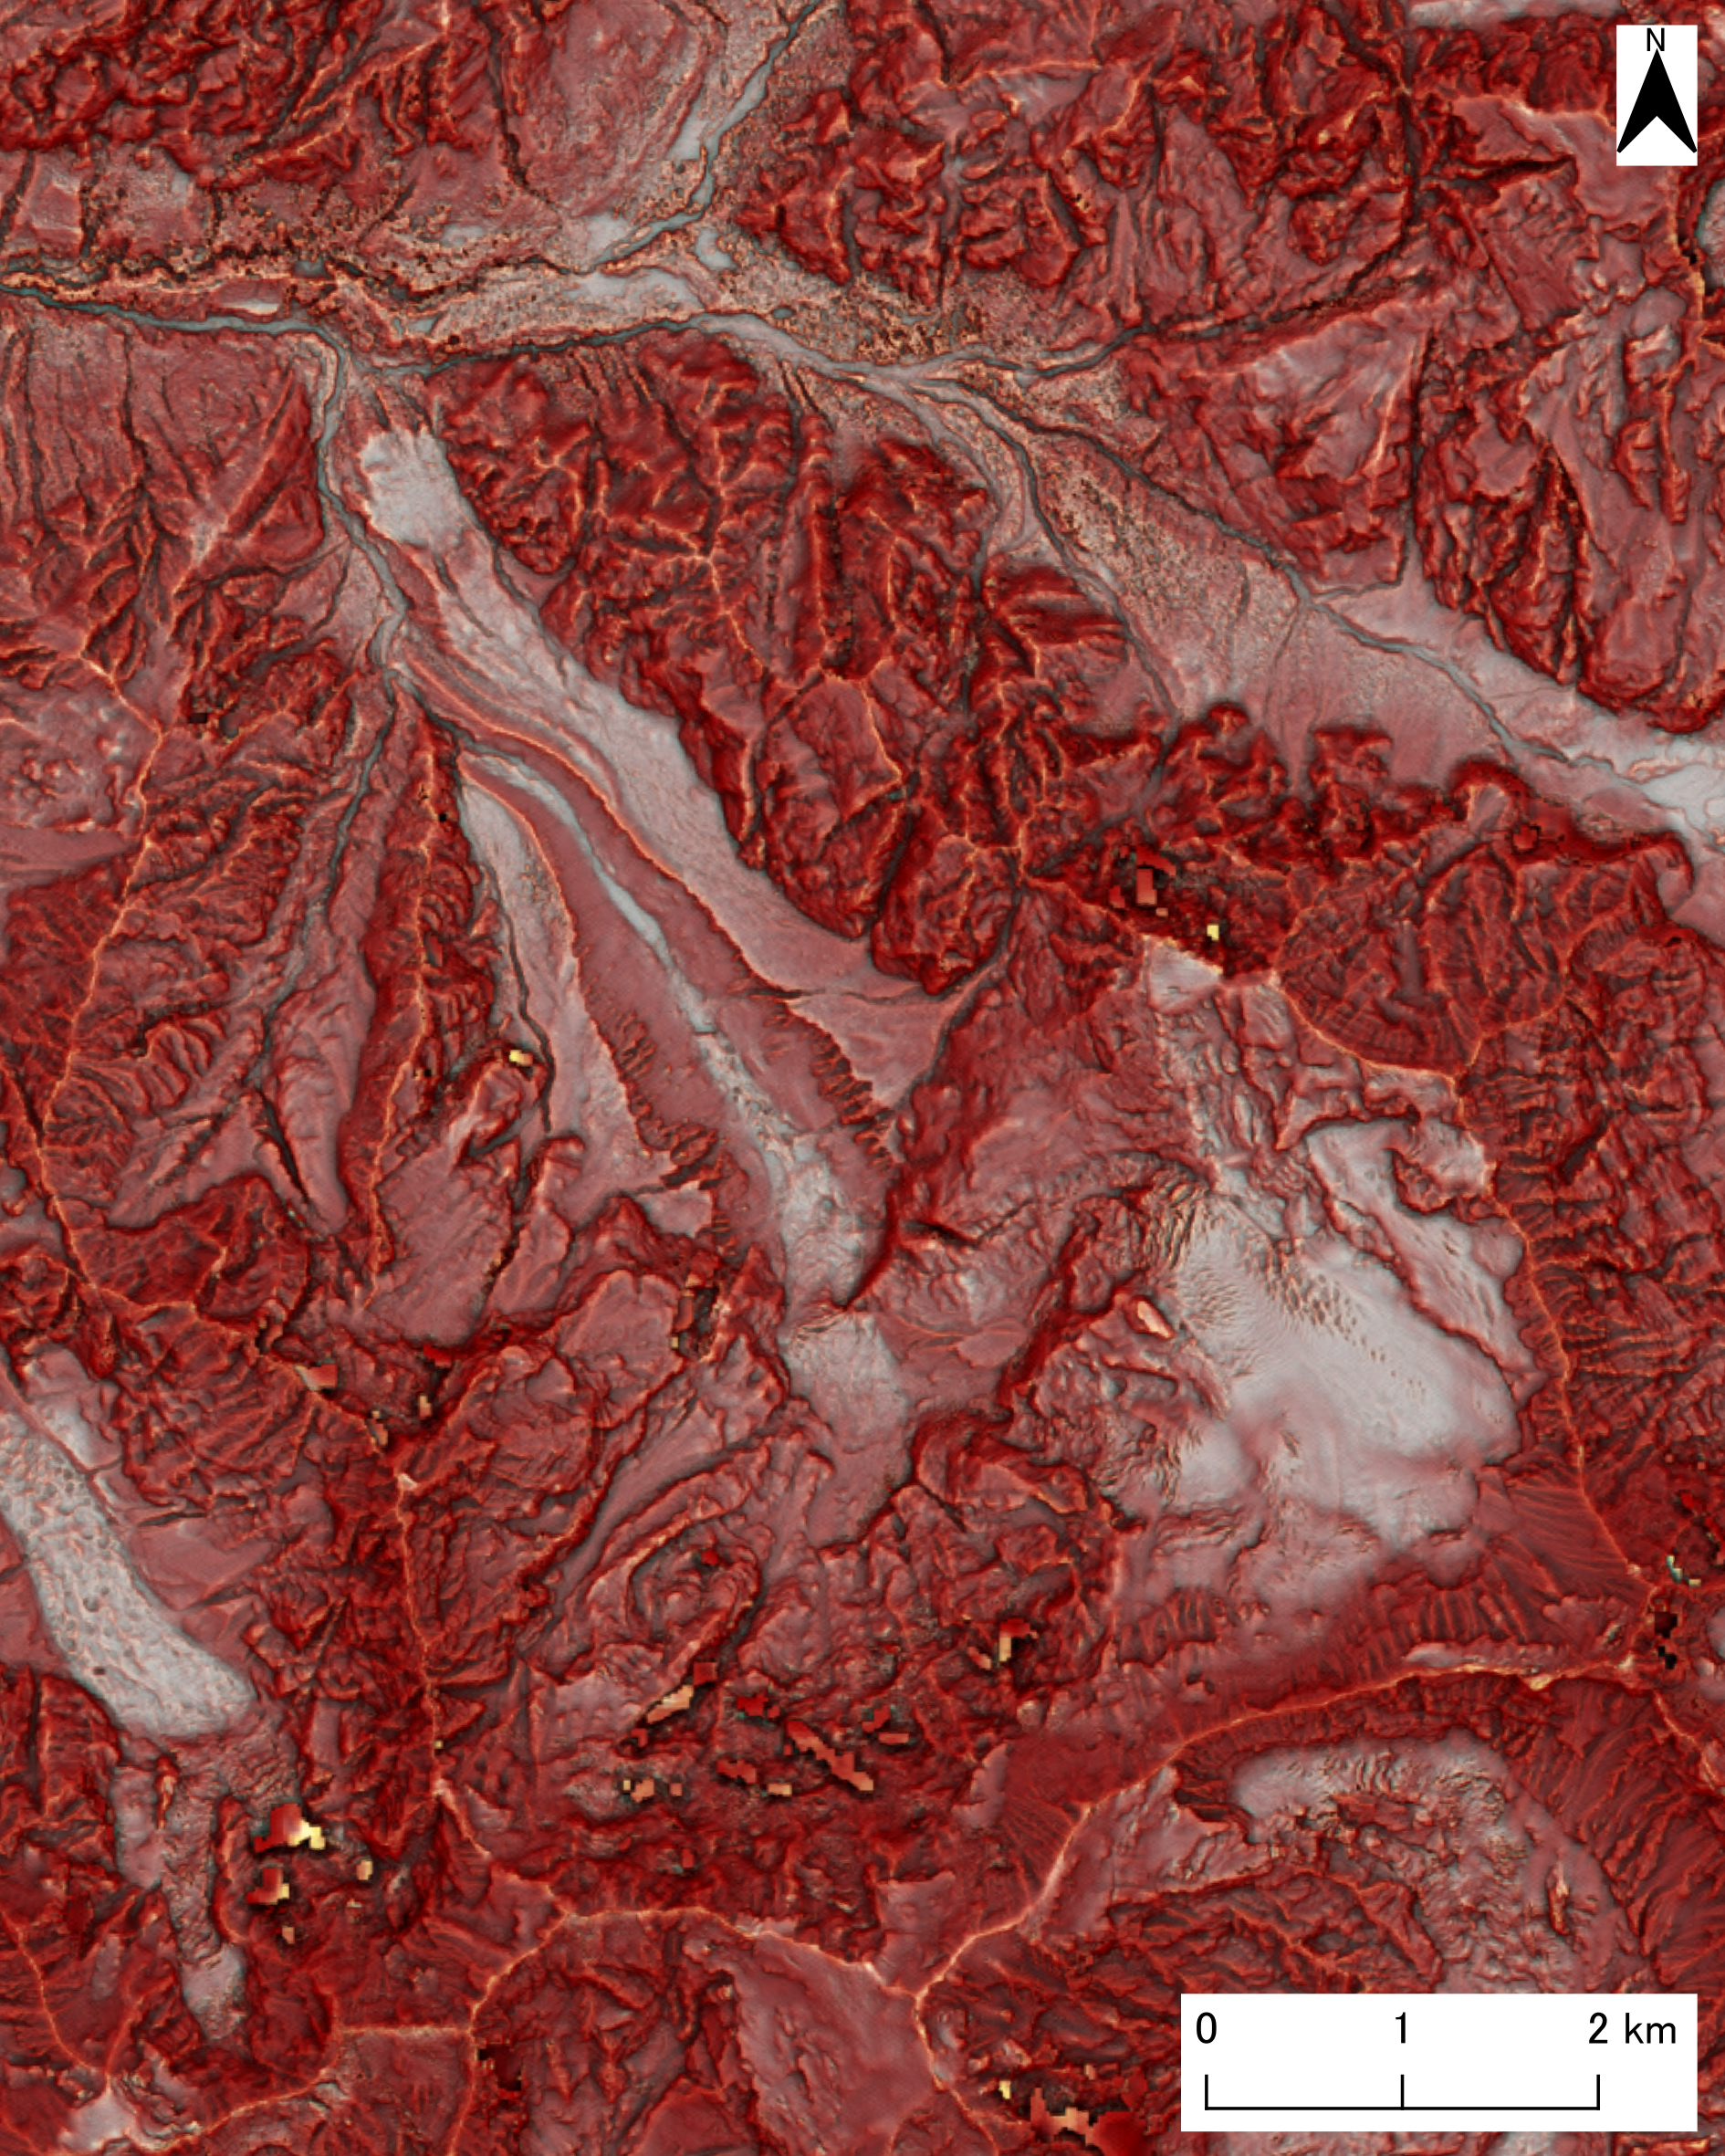
|
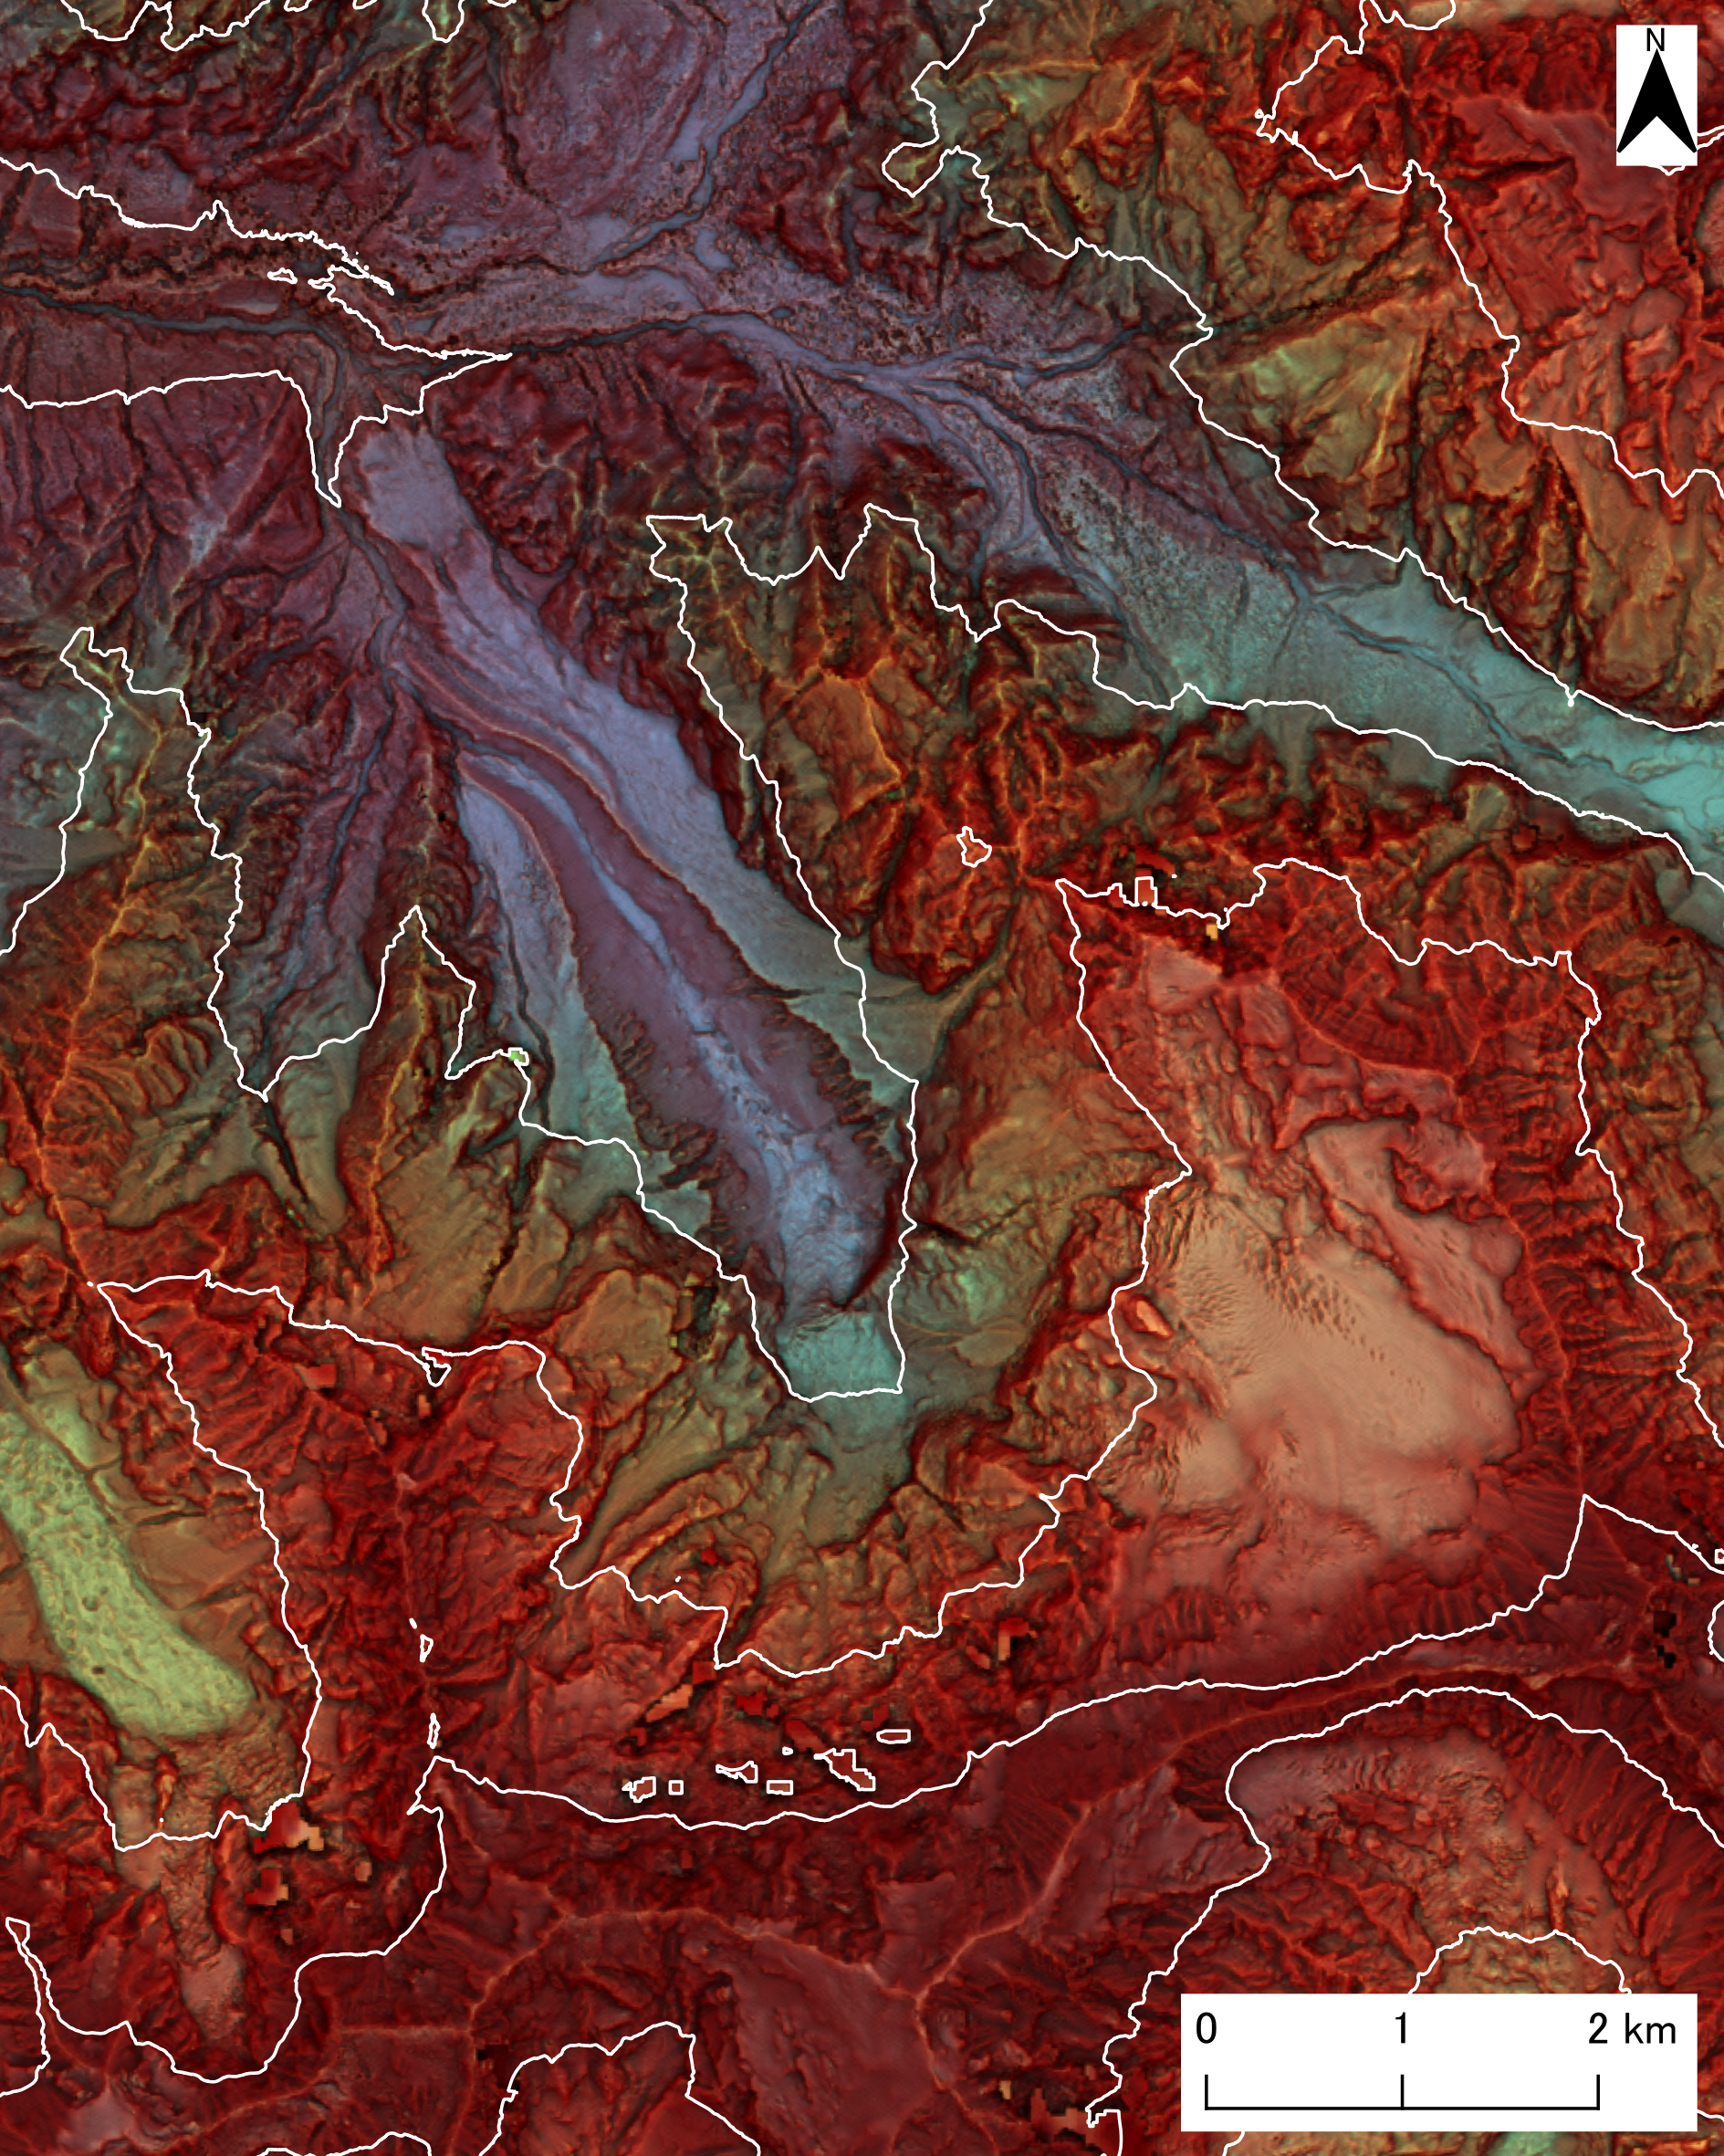
|
○ Red Relief Image Map (Plan View: Detail around the Collapse Site)
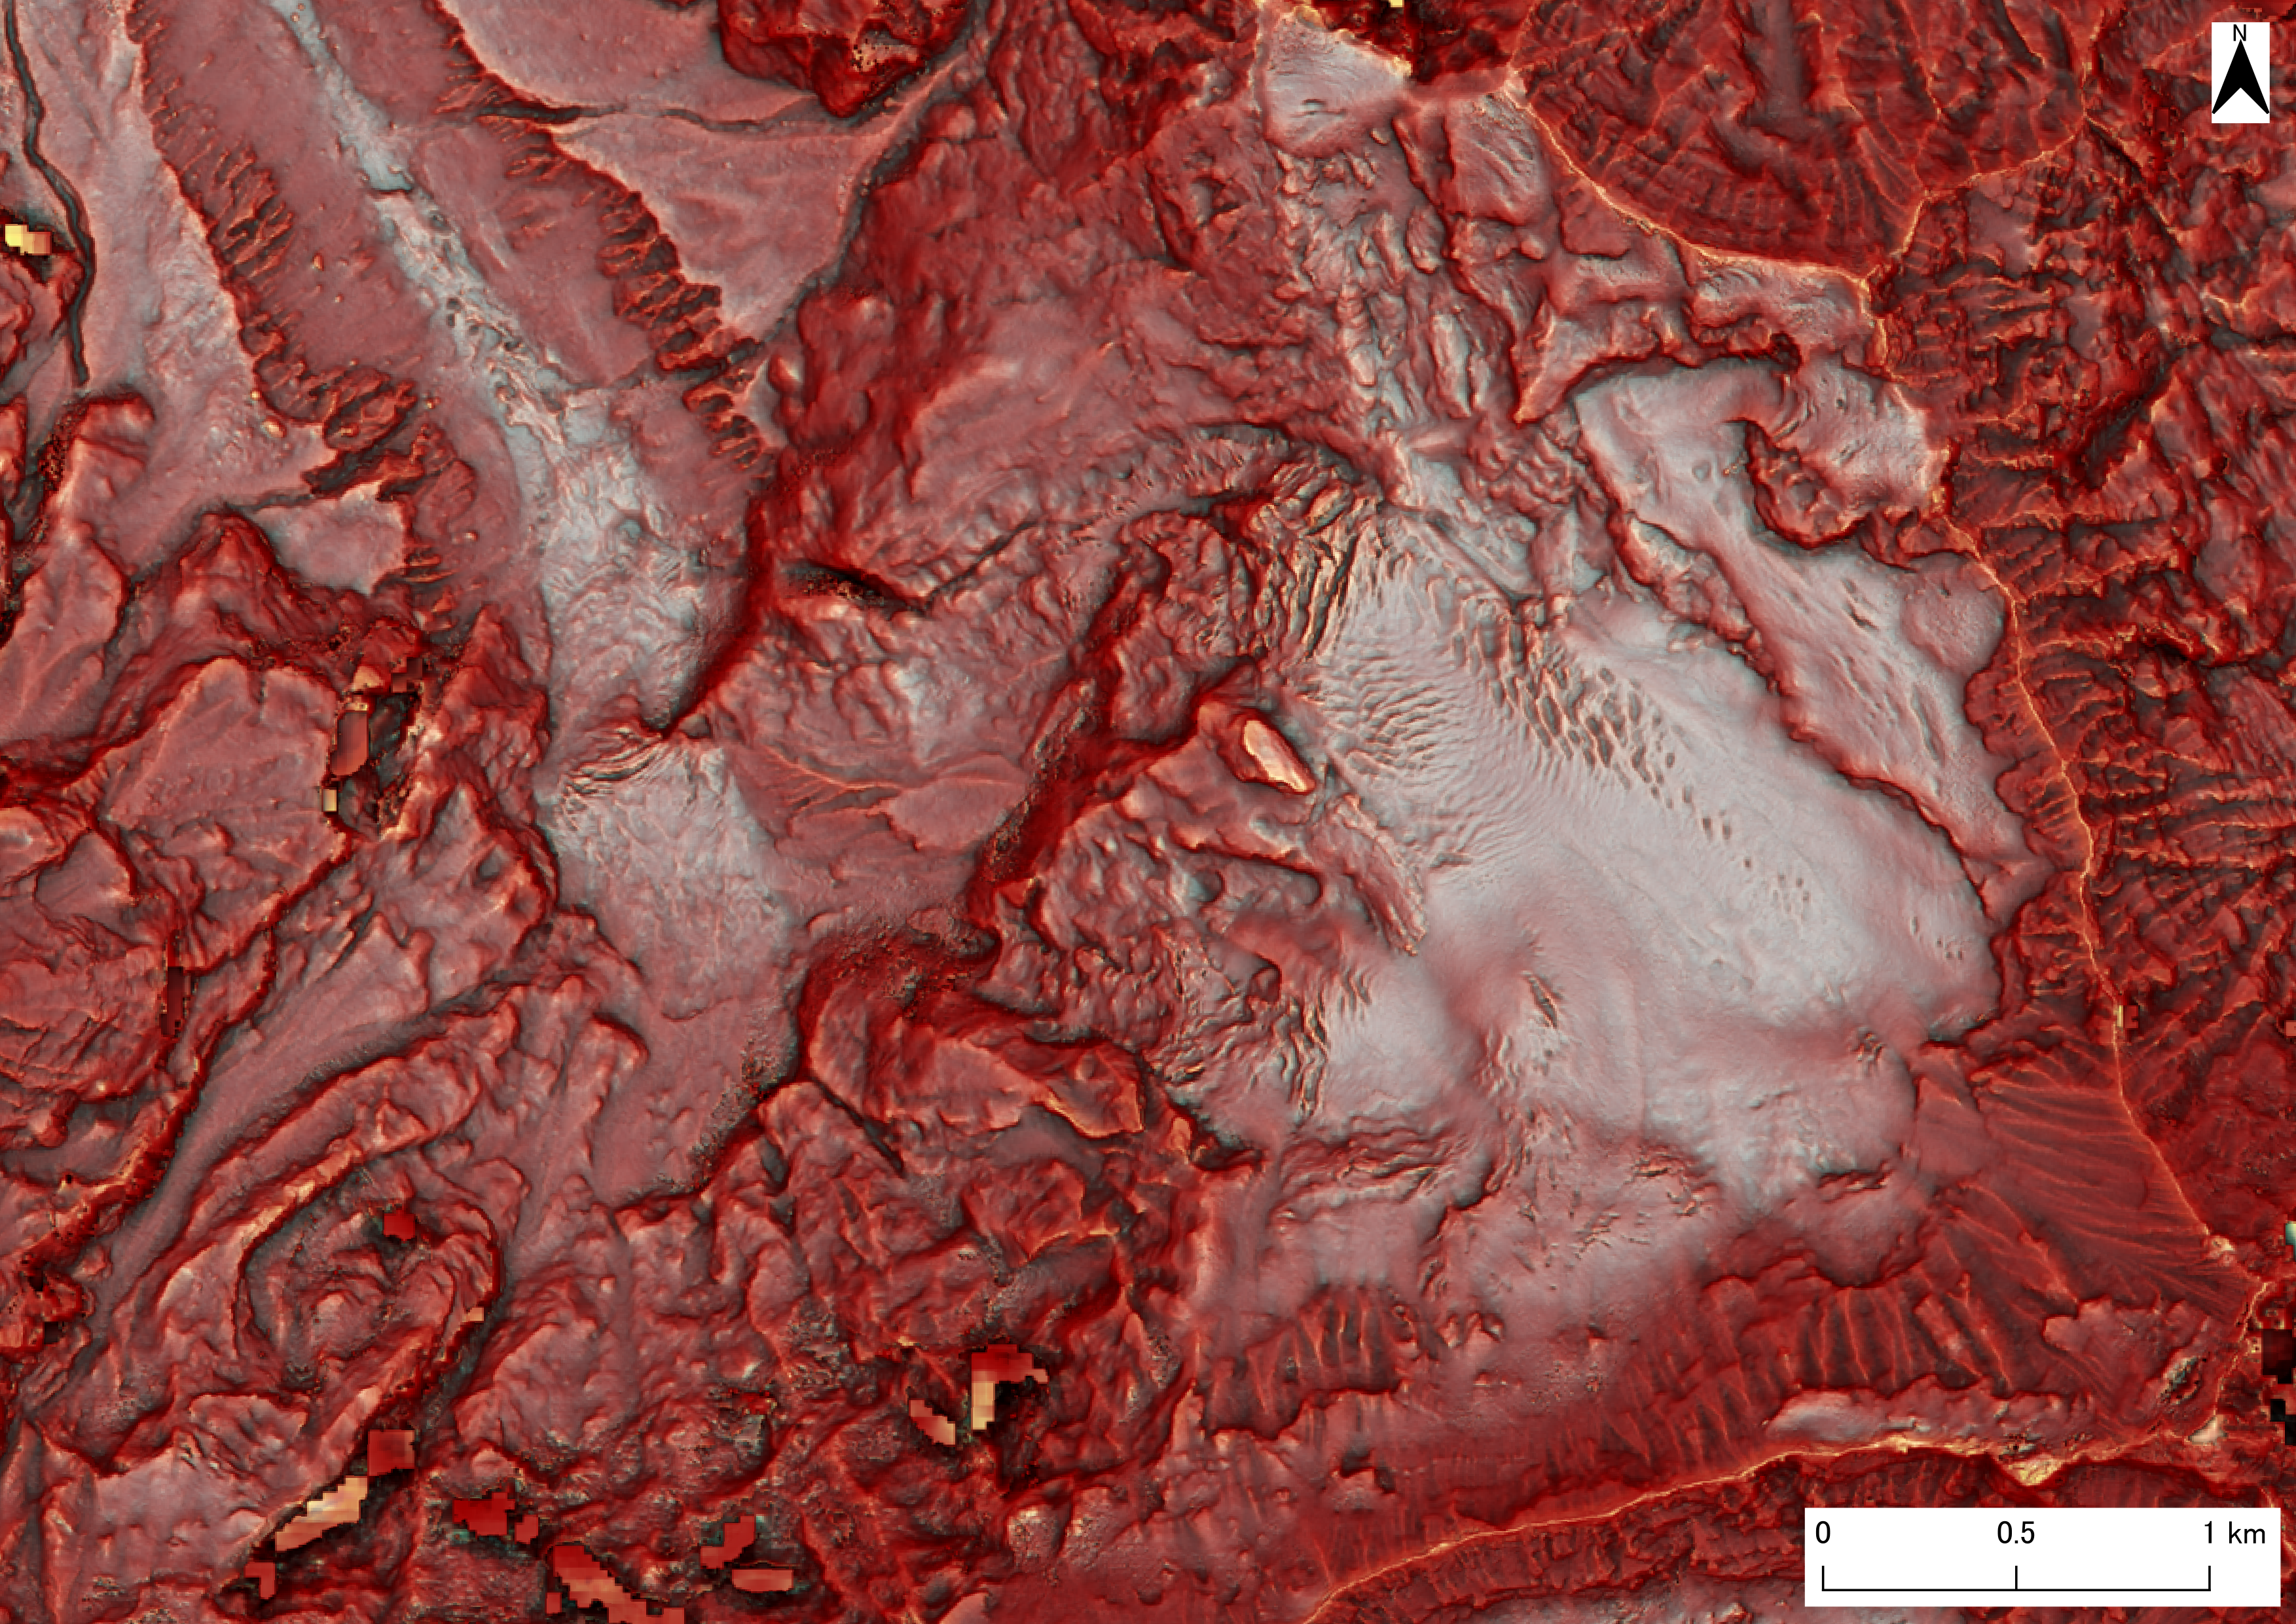
○ Red Relief Image Map (Oblique View: Surroundings of the Collapse Site)
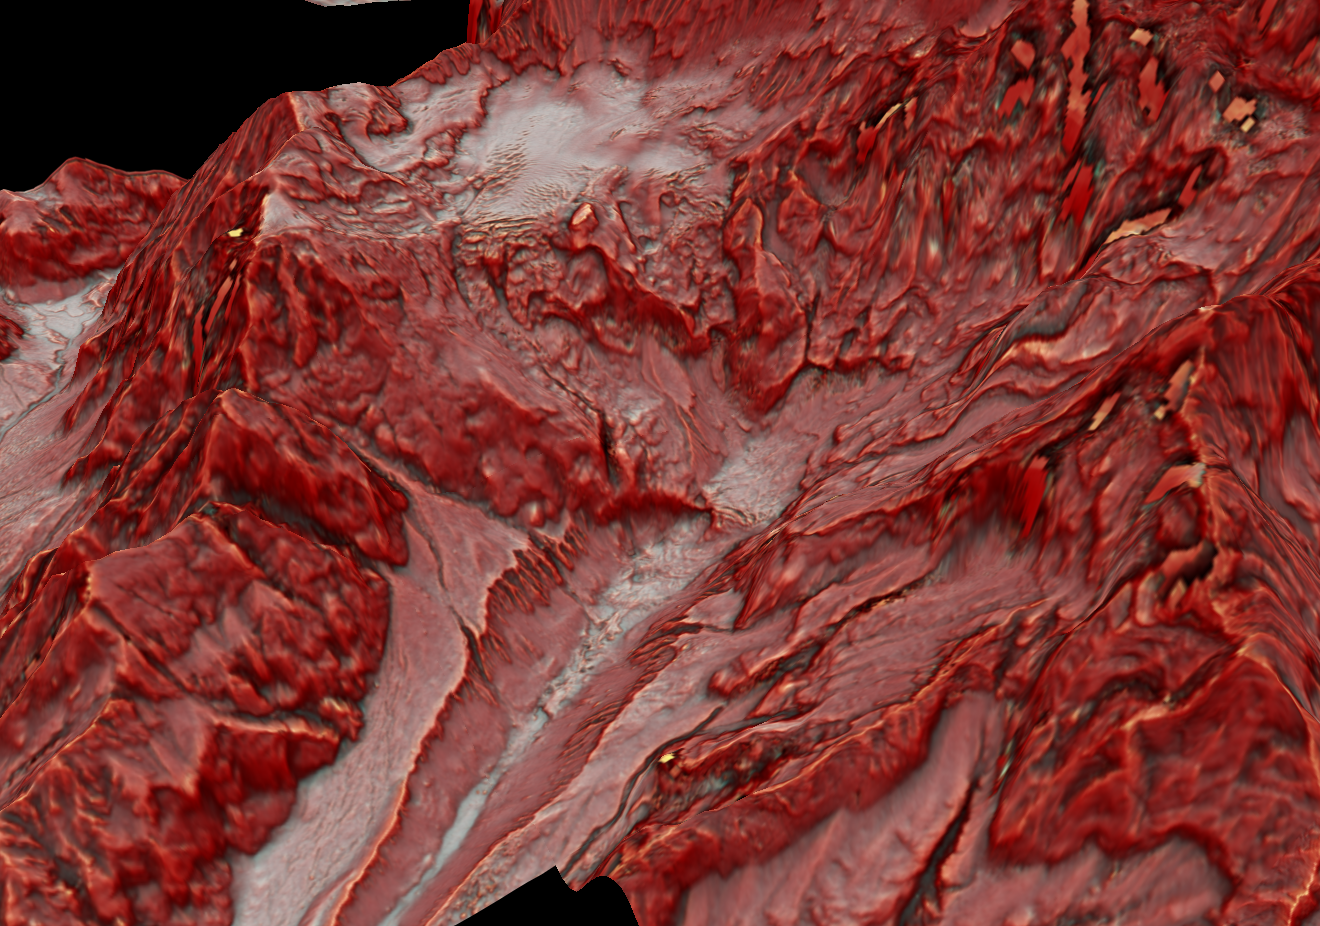
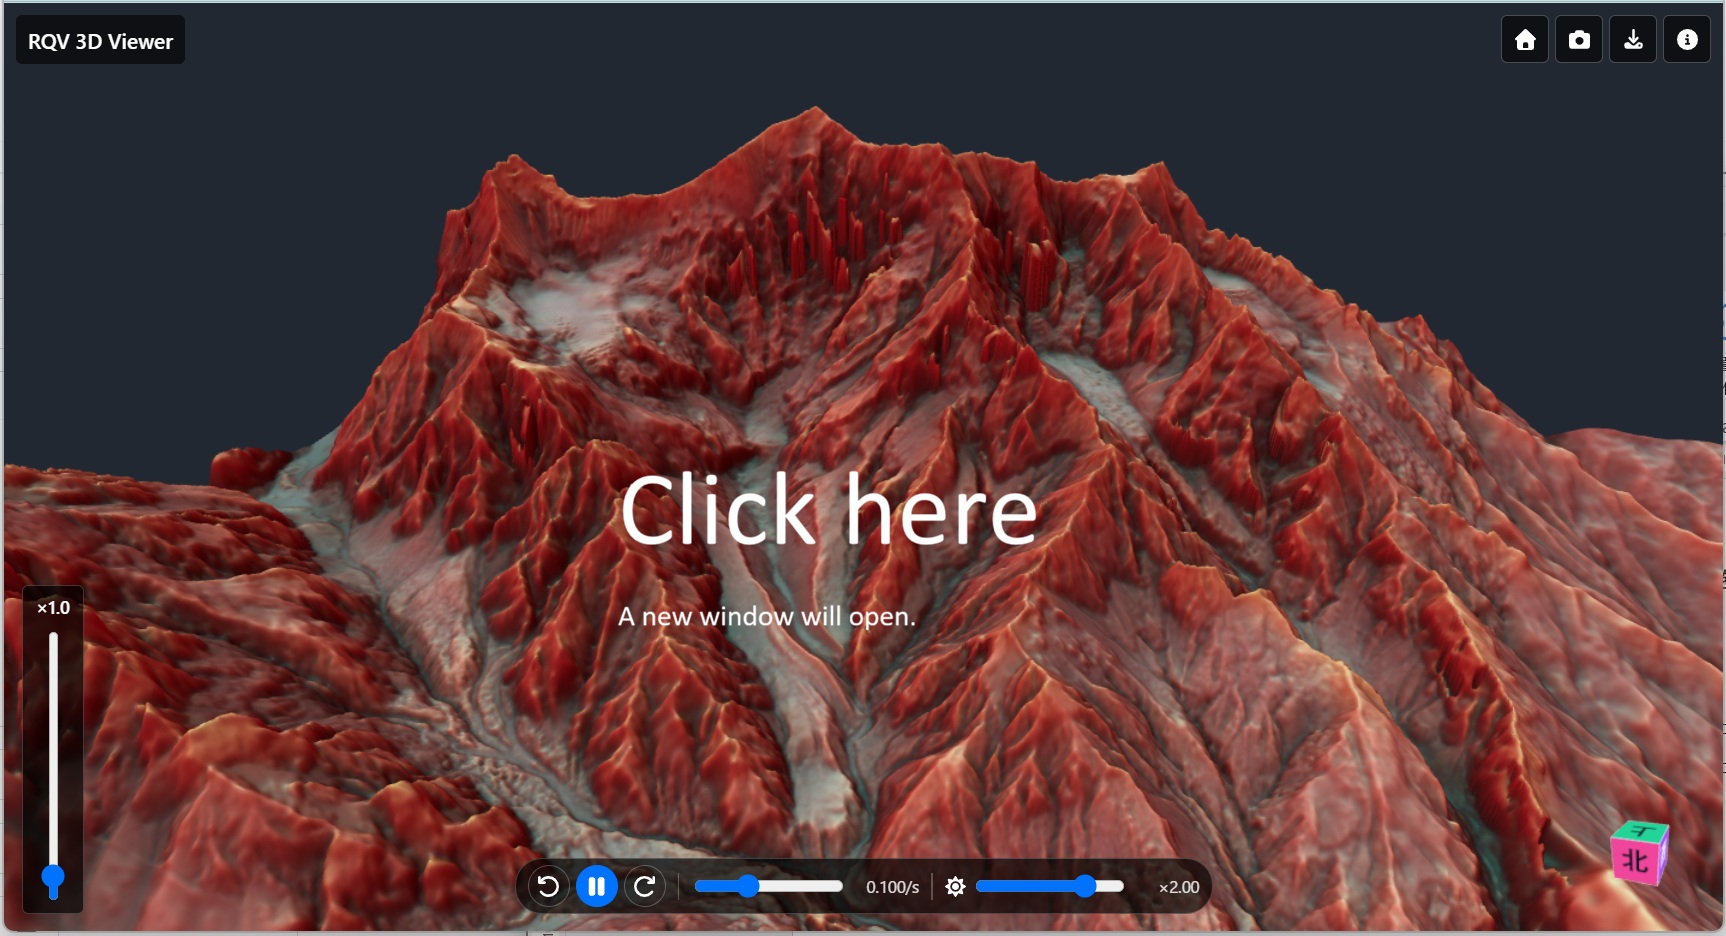
○ Red Relief Image Map (3D Viewer)
The Red Relief Image Map can be viewed in 3D to examine the terrain from any direction. Use the mouse to zoom, rotate, and pan the view.
◆ Controls
Zoom: scroll the mouse wheel
Rotate: click and drag with the left mouse button
Pan: click and drag with the right mouse button
○ Comparison Video of Pre-Collapse Red Relief Image Map and Satellite Imagery
A video was created to compare satellite imagery before and after the collapse with the pre-collapse Red Relief Image Map. The Red Relief Image Map helps to reveal topographic features that are difficult to interpret from satellite imagery alone.