NEWS
2016 Kumamoto Earthquake (English)
2016 Kumamoto Earthquake |
|
日本文はこちらから
We present our deepest condolences to those who lost loved ones in the earthquakes, and also to express our sympathy to all who were affected in Kumamoto and Oita prefecture, Kyusyu.
April 14, 2016 at PM 9:26 (local time), a M6.5 earthquake (JMA Seismic Intensity-Upper 6 at max) occurred in an epicenter located directly beneath the city of Kumamoto. After the quake, April 16 at AM 1:25, a M7.3 earthquake (JMA Seismic Intensity-7) occurred again. Asia Air Survey implemented an emergency observation at damaged areas. The information is opened to the public through our homepage in free. We highly hope our technology is useful for constraining the second disaster and understanding the quake’s mechanism. Update: June, 14, 2016
|
| ■An approach of crustal deformation analysis based on comparison of two periods of Lidar measurement | |
|
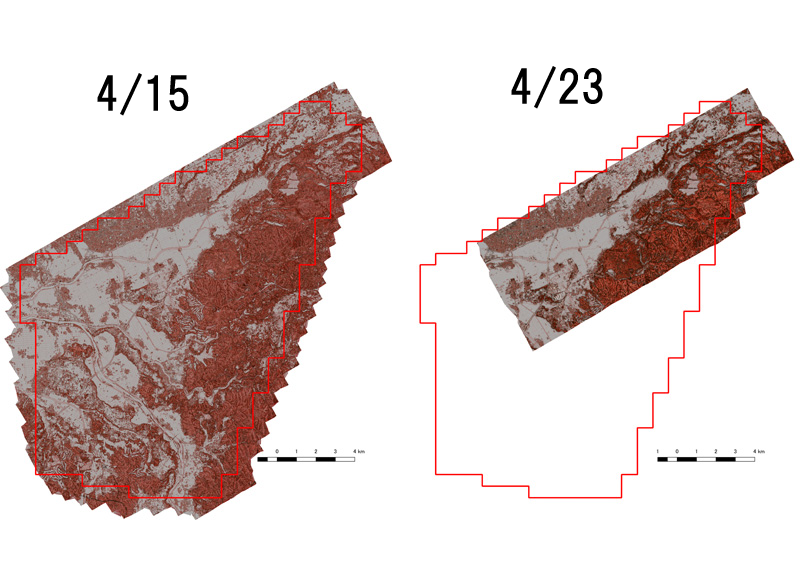
Asia Air Survey, Co., Ltd. took Airborne Lidar measurement on April 15, 2016 for confirm the seismic surface fault after the earthquake occurred on April 14.
The expected mainshock struck in the early morning of April 16, and we confirmed seismic surface fault appeared in the same area where we have taken Lidar measurement on April 15. So we decided to take another Lidar measurement on April 23, along the same courses, using same airplane and same sensors of the measurement of April 15. Based on the results from two period’s measurement, we confirmed seismic surface fault and detected very small deformation of the fault. |
|
|
Fig.1 Lidar measurement area before and after the mainshock of the Kumamoto Earthquake
|
|
|
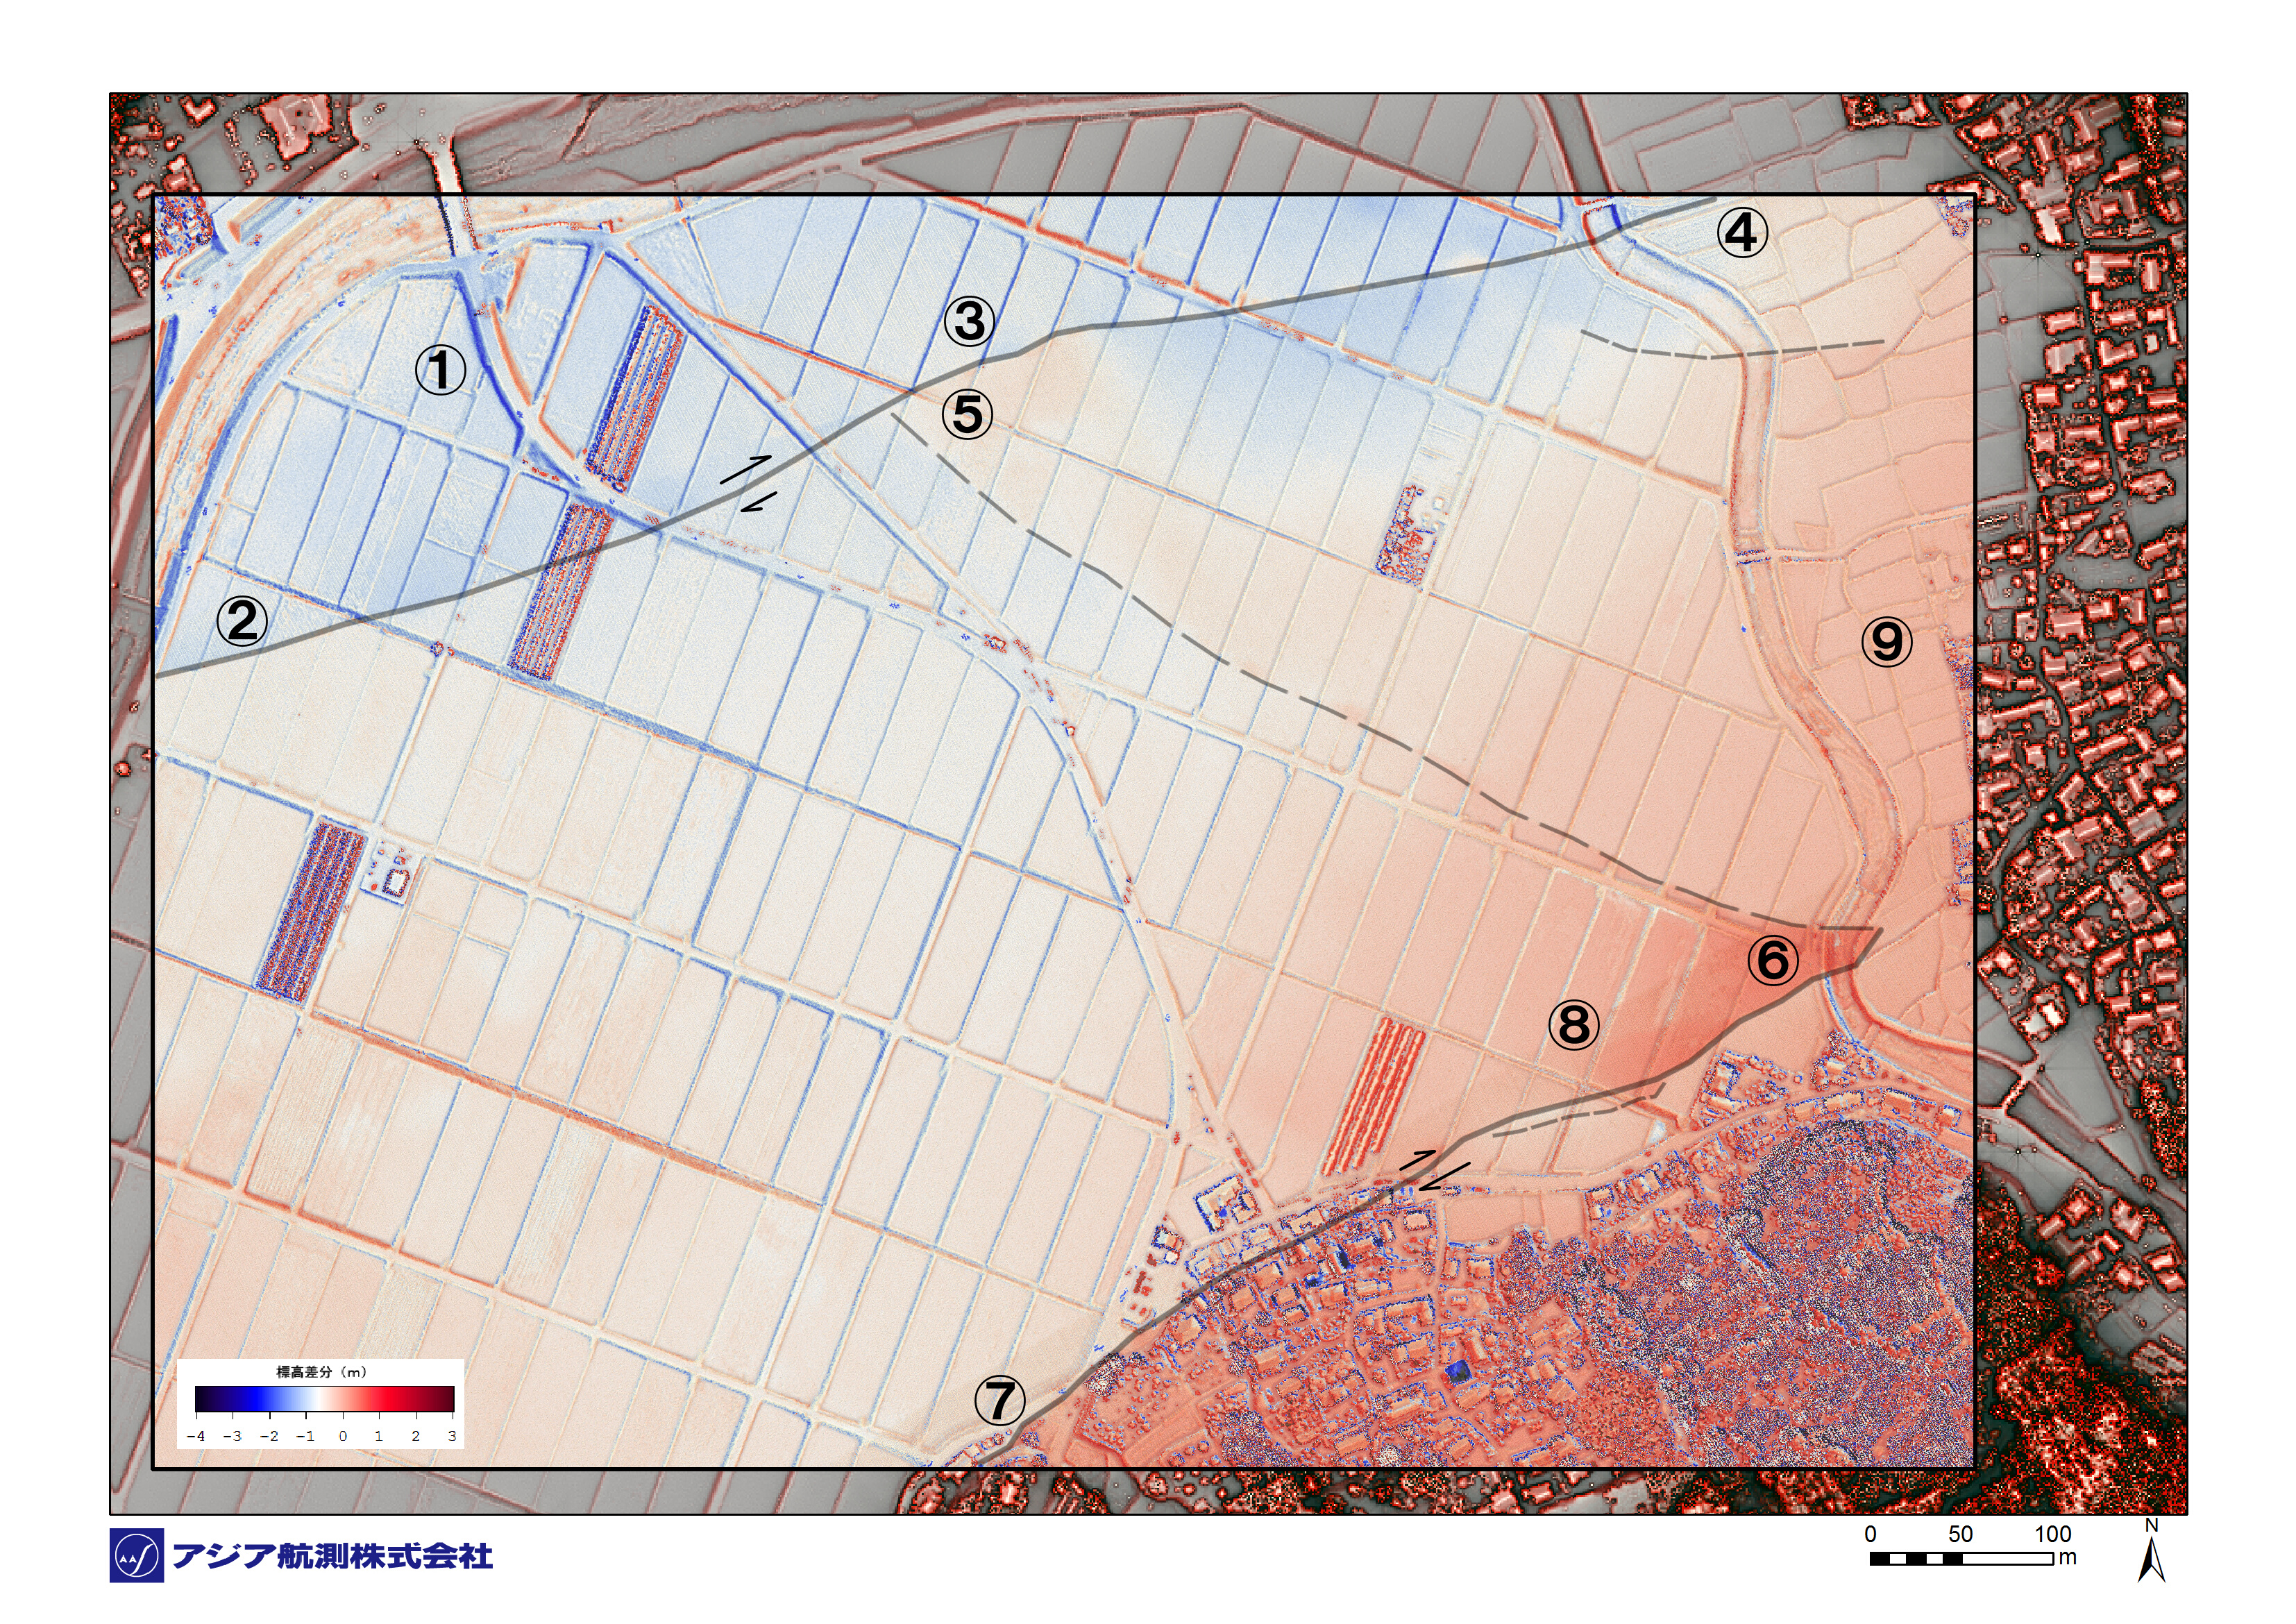
Fig.2 Comparison of Red Relief Image Maps created by Lidar data of April 15 and 23 (Near Tsumori Elementary School of Kamijin, Masuki Town)
A very clear right-lateral displacement can be recognized along the central part of the study area, as the upper (north) side is moving right (east) direction compared to the lower (south) side.
|
|
|
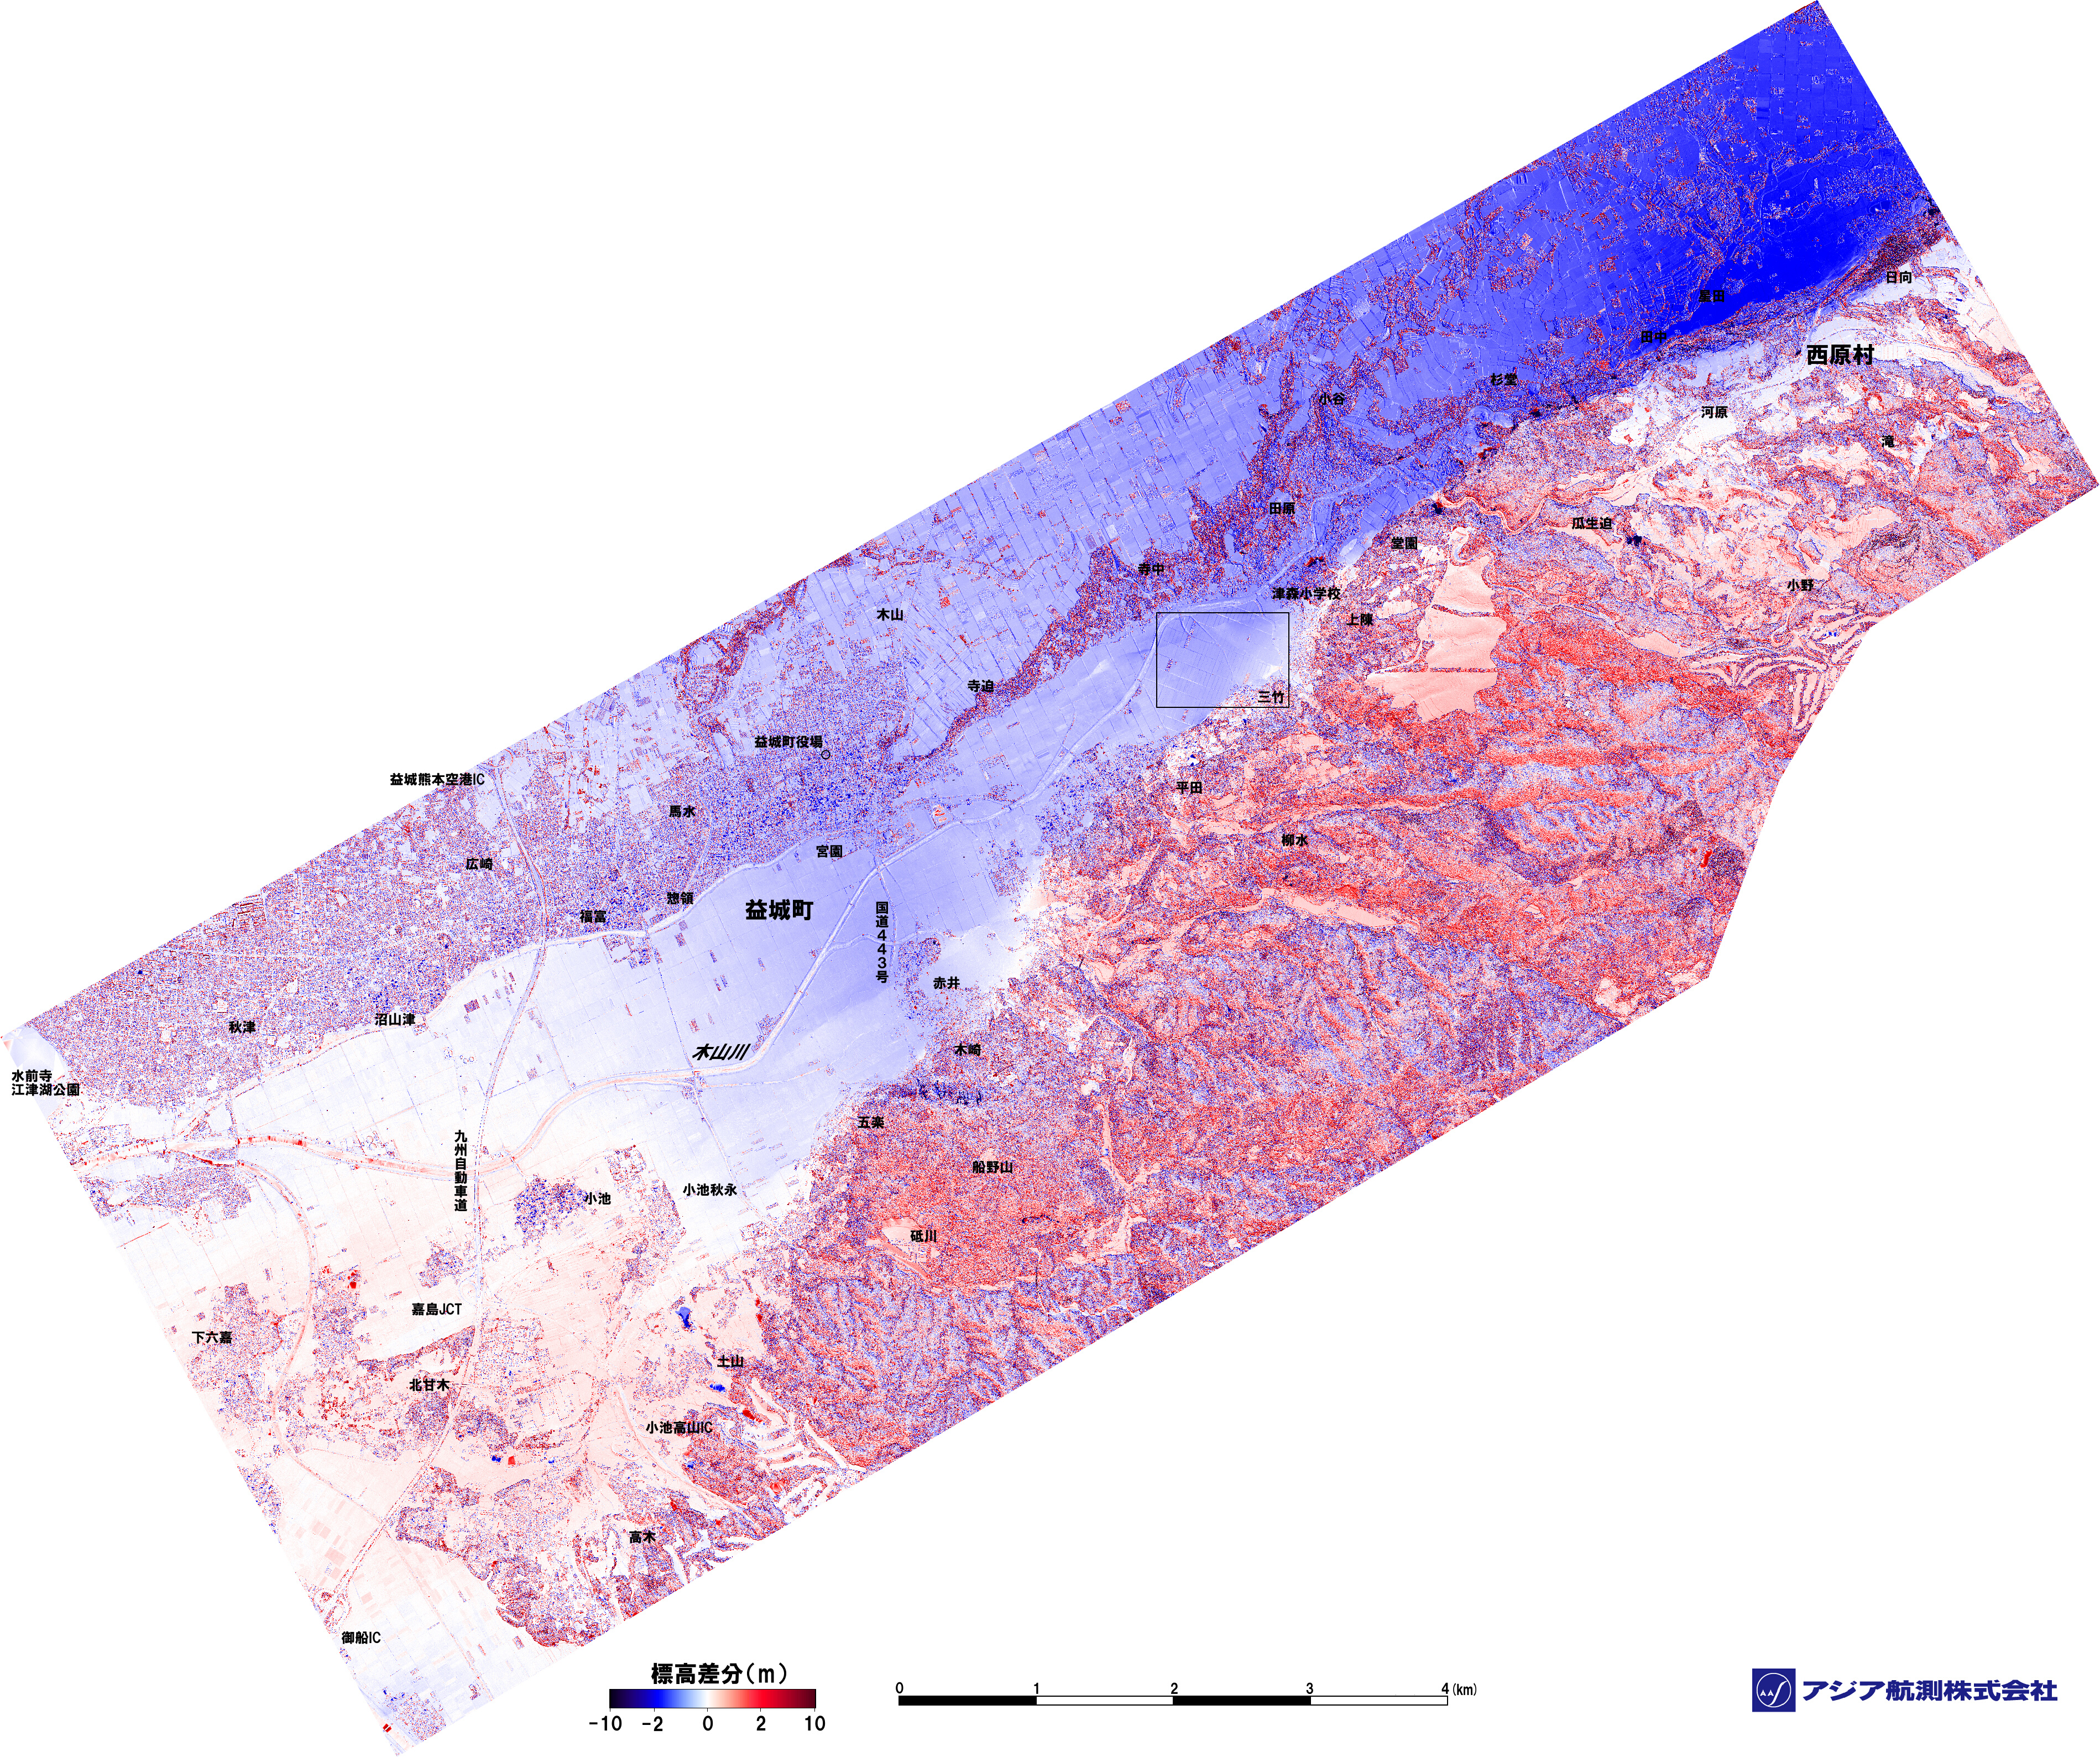
Fig.3 Differential map in a large area
|
|
|
Fig.4, Overlapped map of RRIM and differential map (the white color is expressed by minus 0.8 m for easy to understand the relationship between differential amount and color). |
|
|
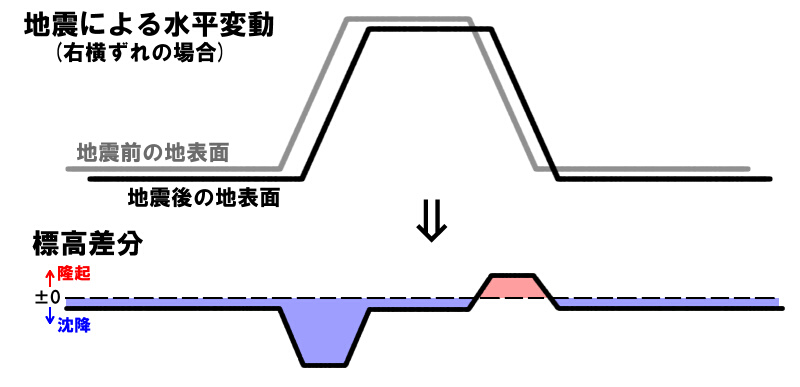
Fig.5 A method to interpret movement of strike-slip fault from differential map
|
 |
(a)Photo No.6695
Near the junction of two faults (near ⑥)。River Revetment structure has been destroyed by fault movement. |
 |
(b)Photo No.6691
The above (a) seen from opposite bank from river. River Revetment structure was uplifted due to two faults. |
 |
(c)Photo No.6690
The left side looking to photo is being higher. |
 |
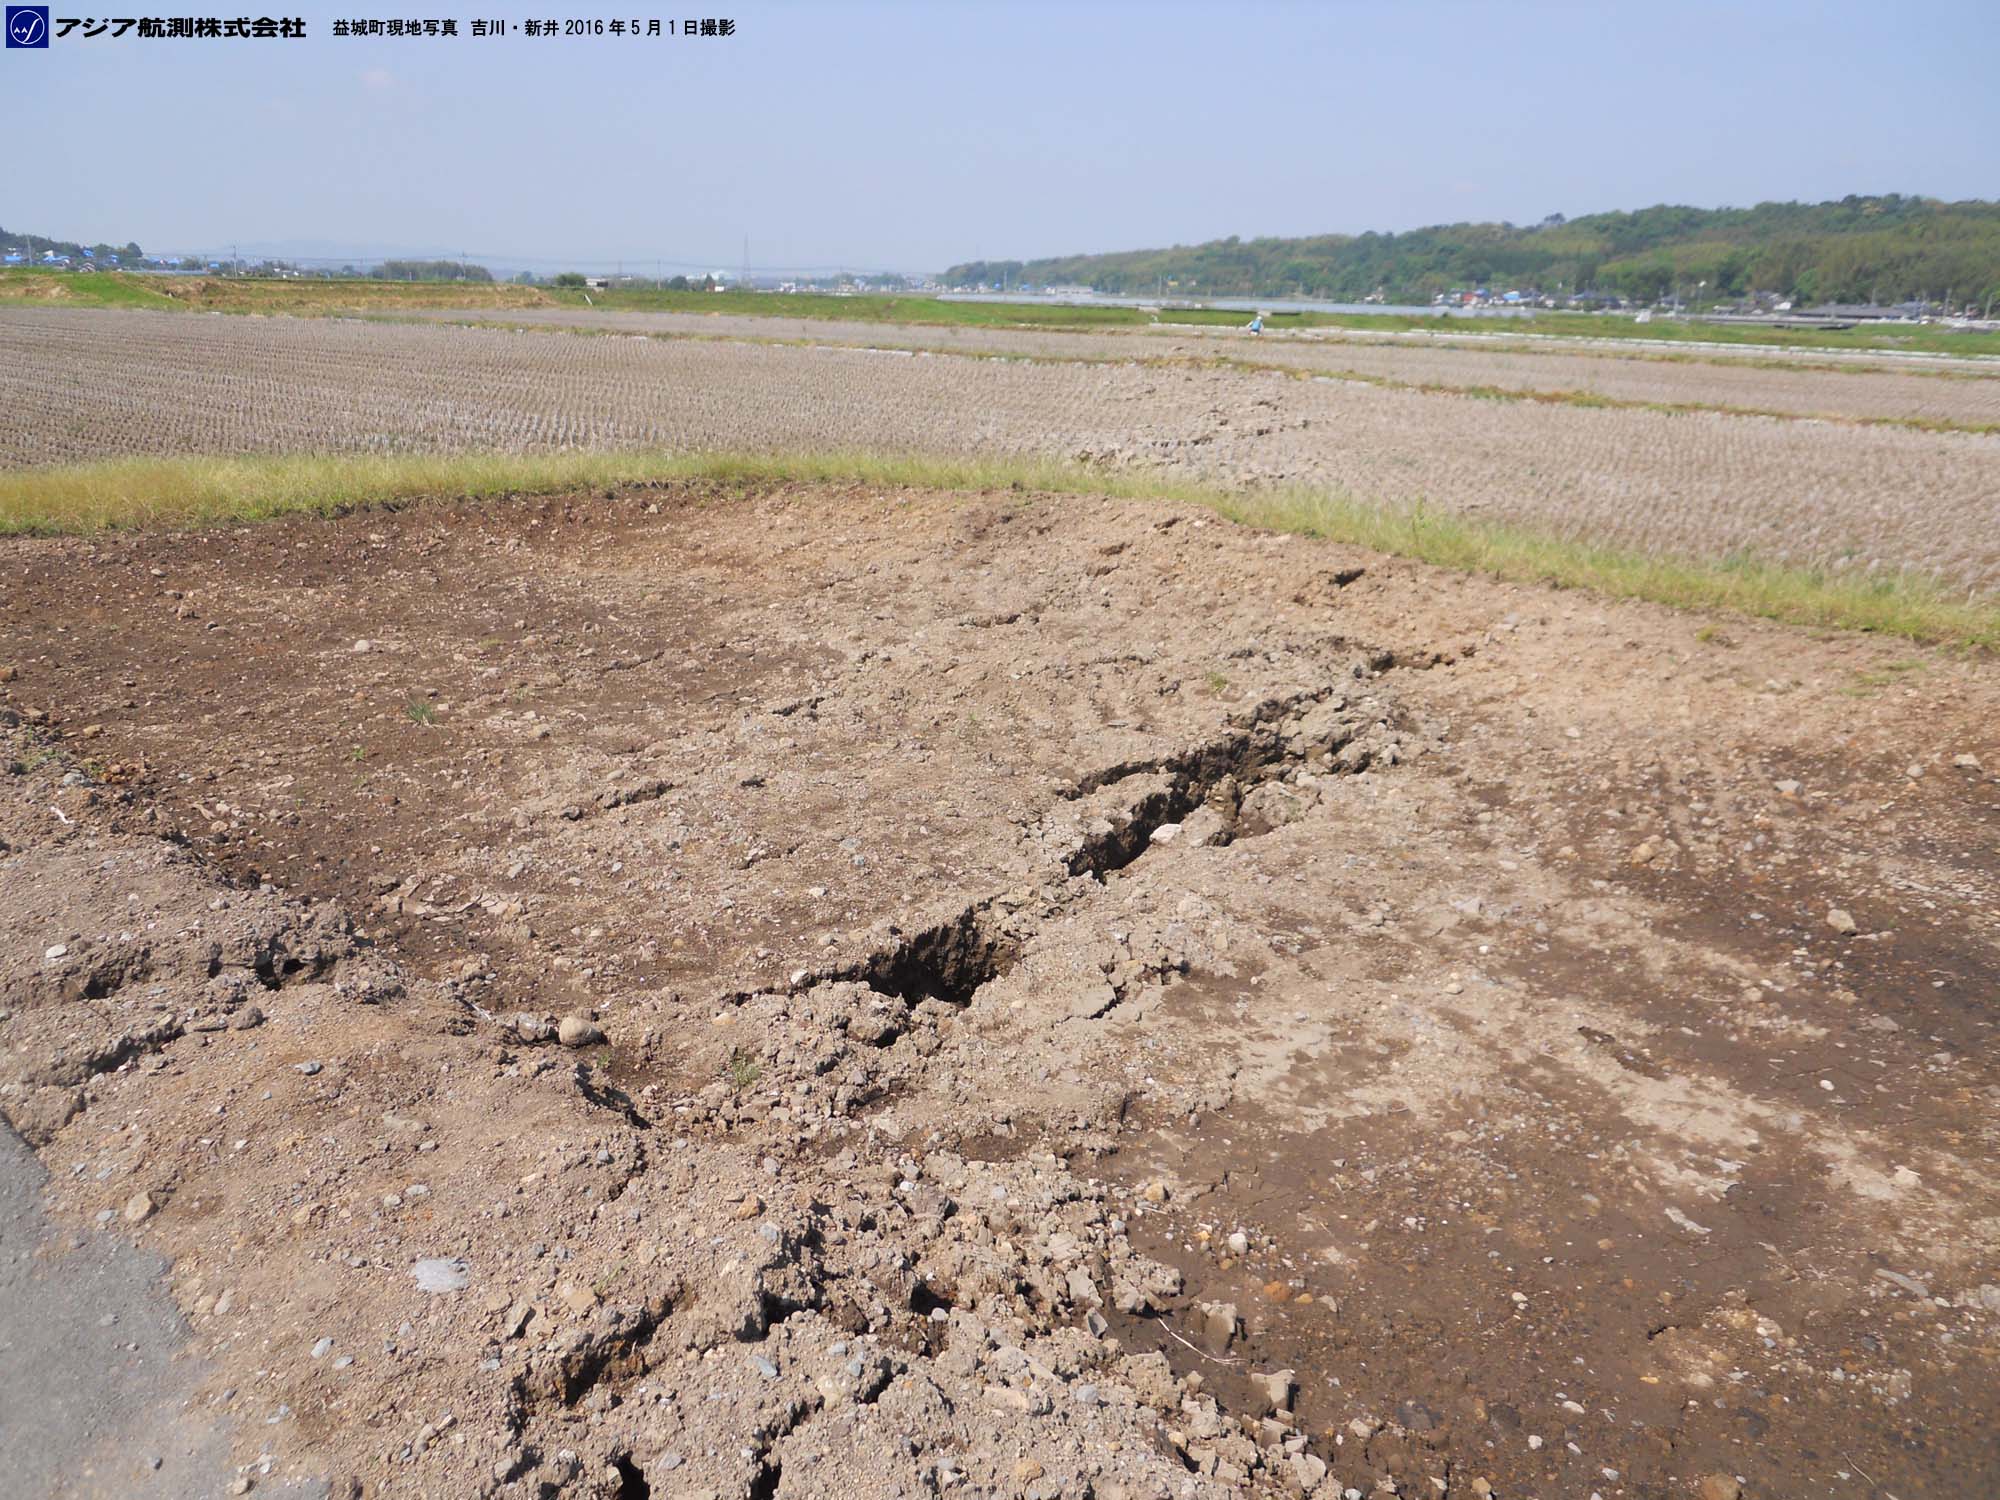
(d)Photo No.6687
A series of left-stepping ruptures were appeared and showing the right-lateral faulting. |
 |
(e)Photo No.6685
A series of left-stepping ruptures were appeared and showing the right-lateral faulting. |
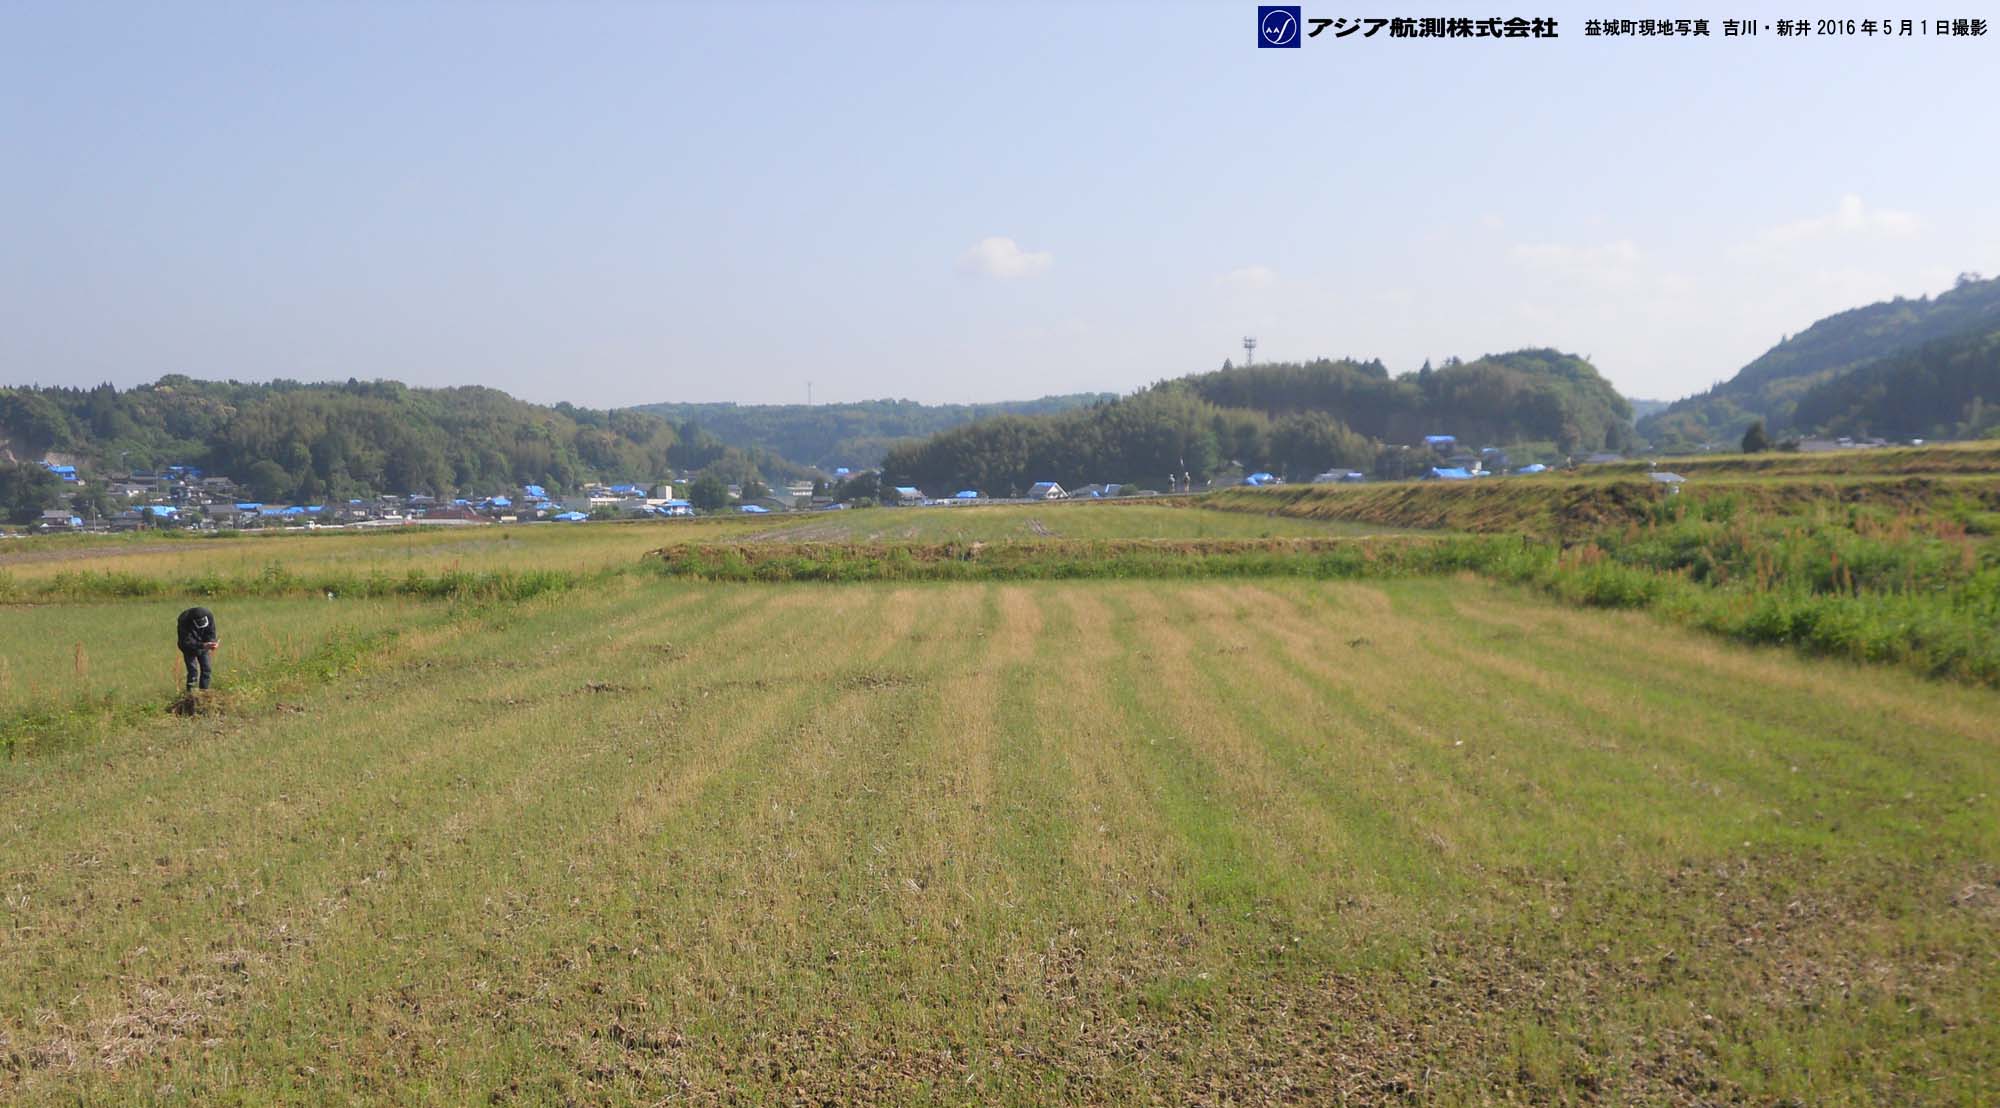 |
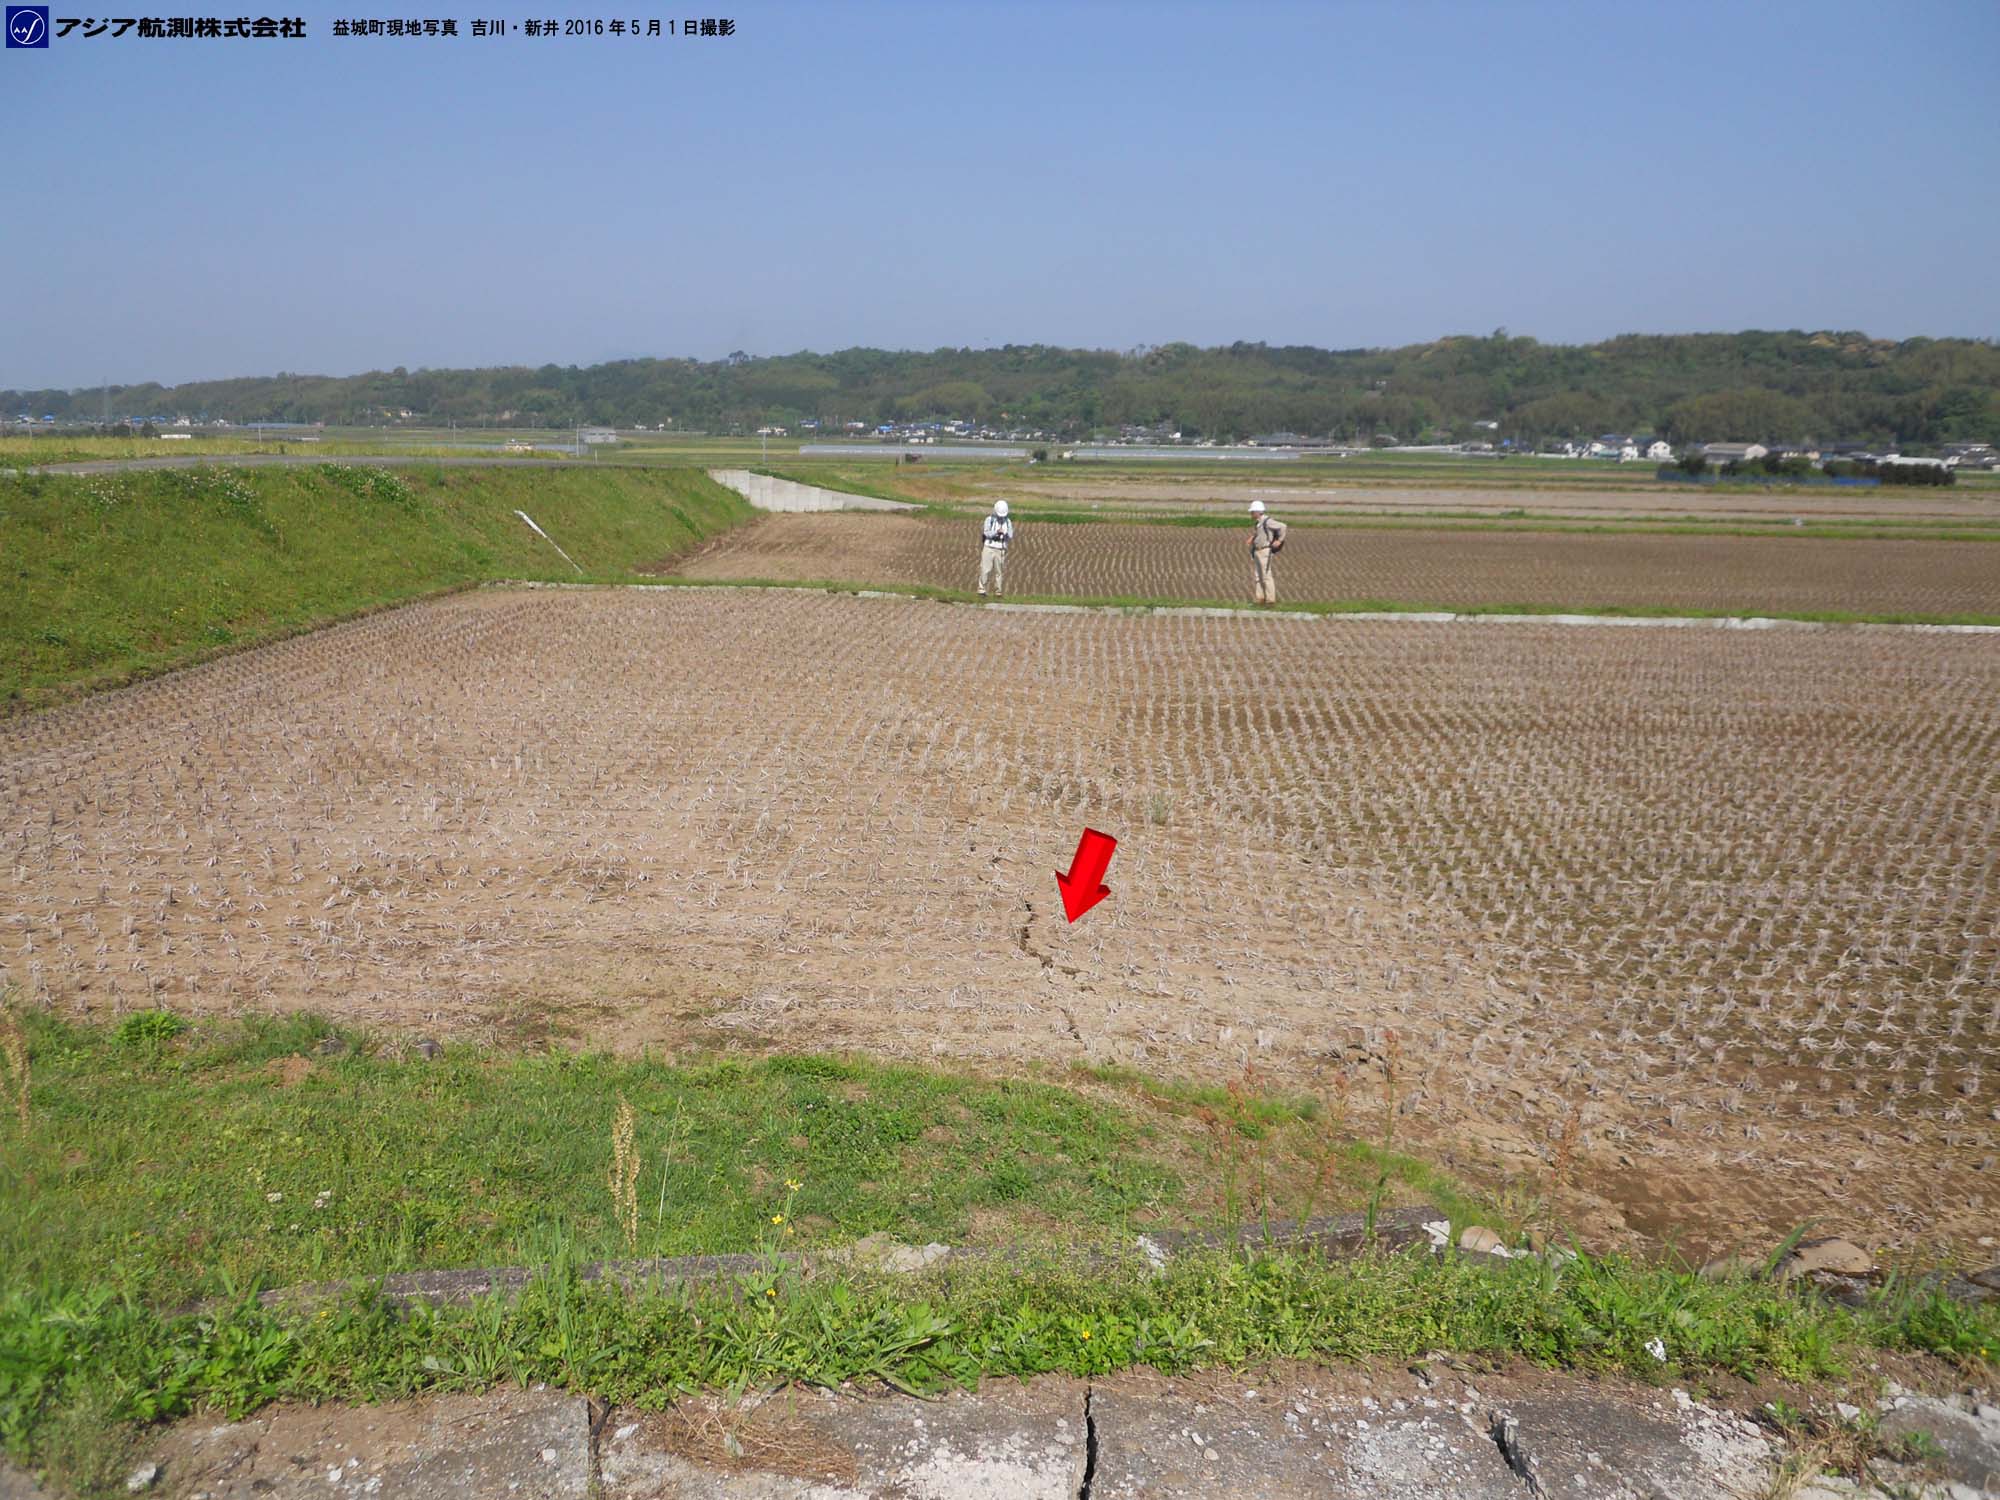
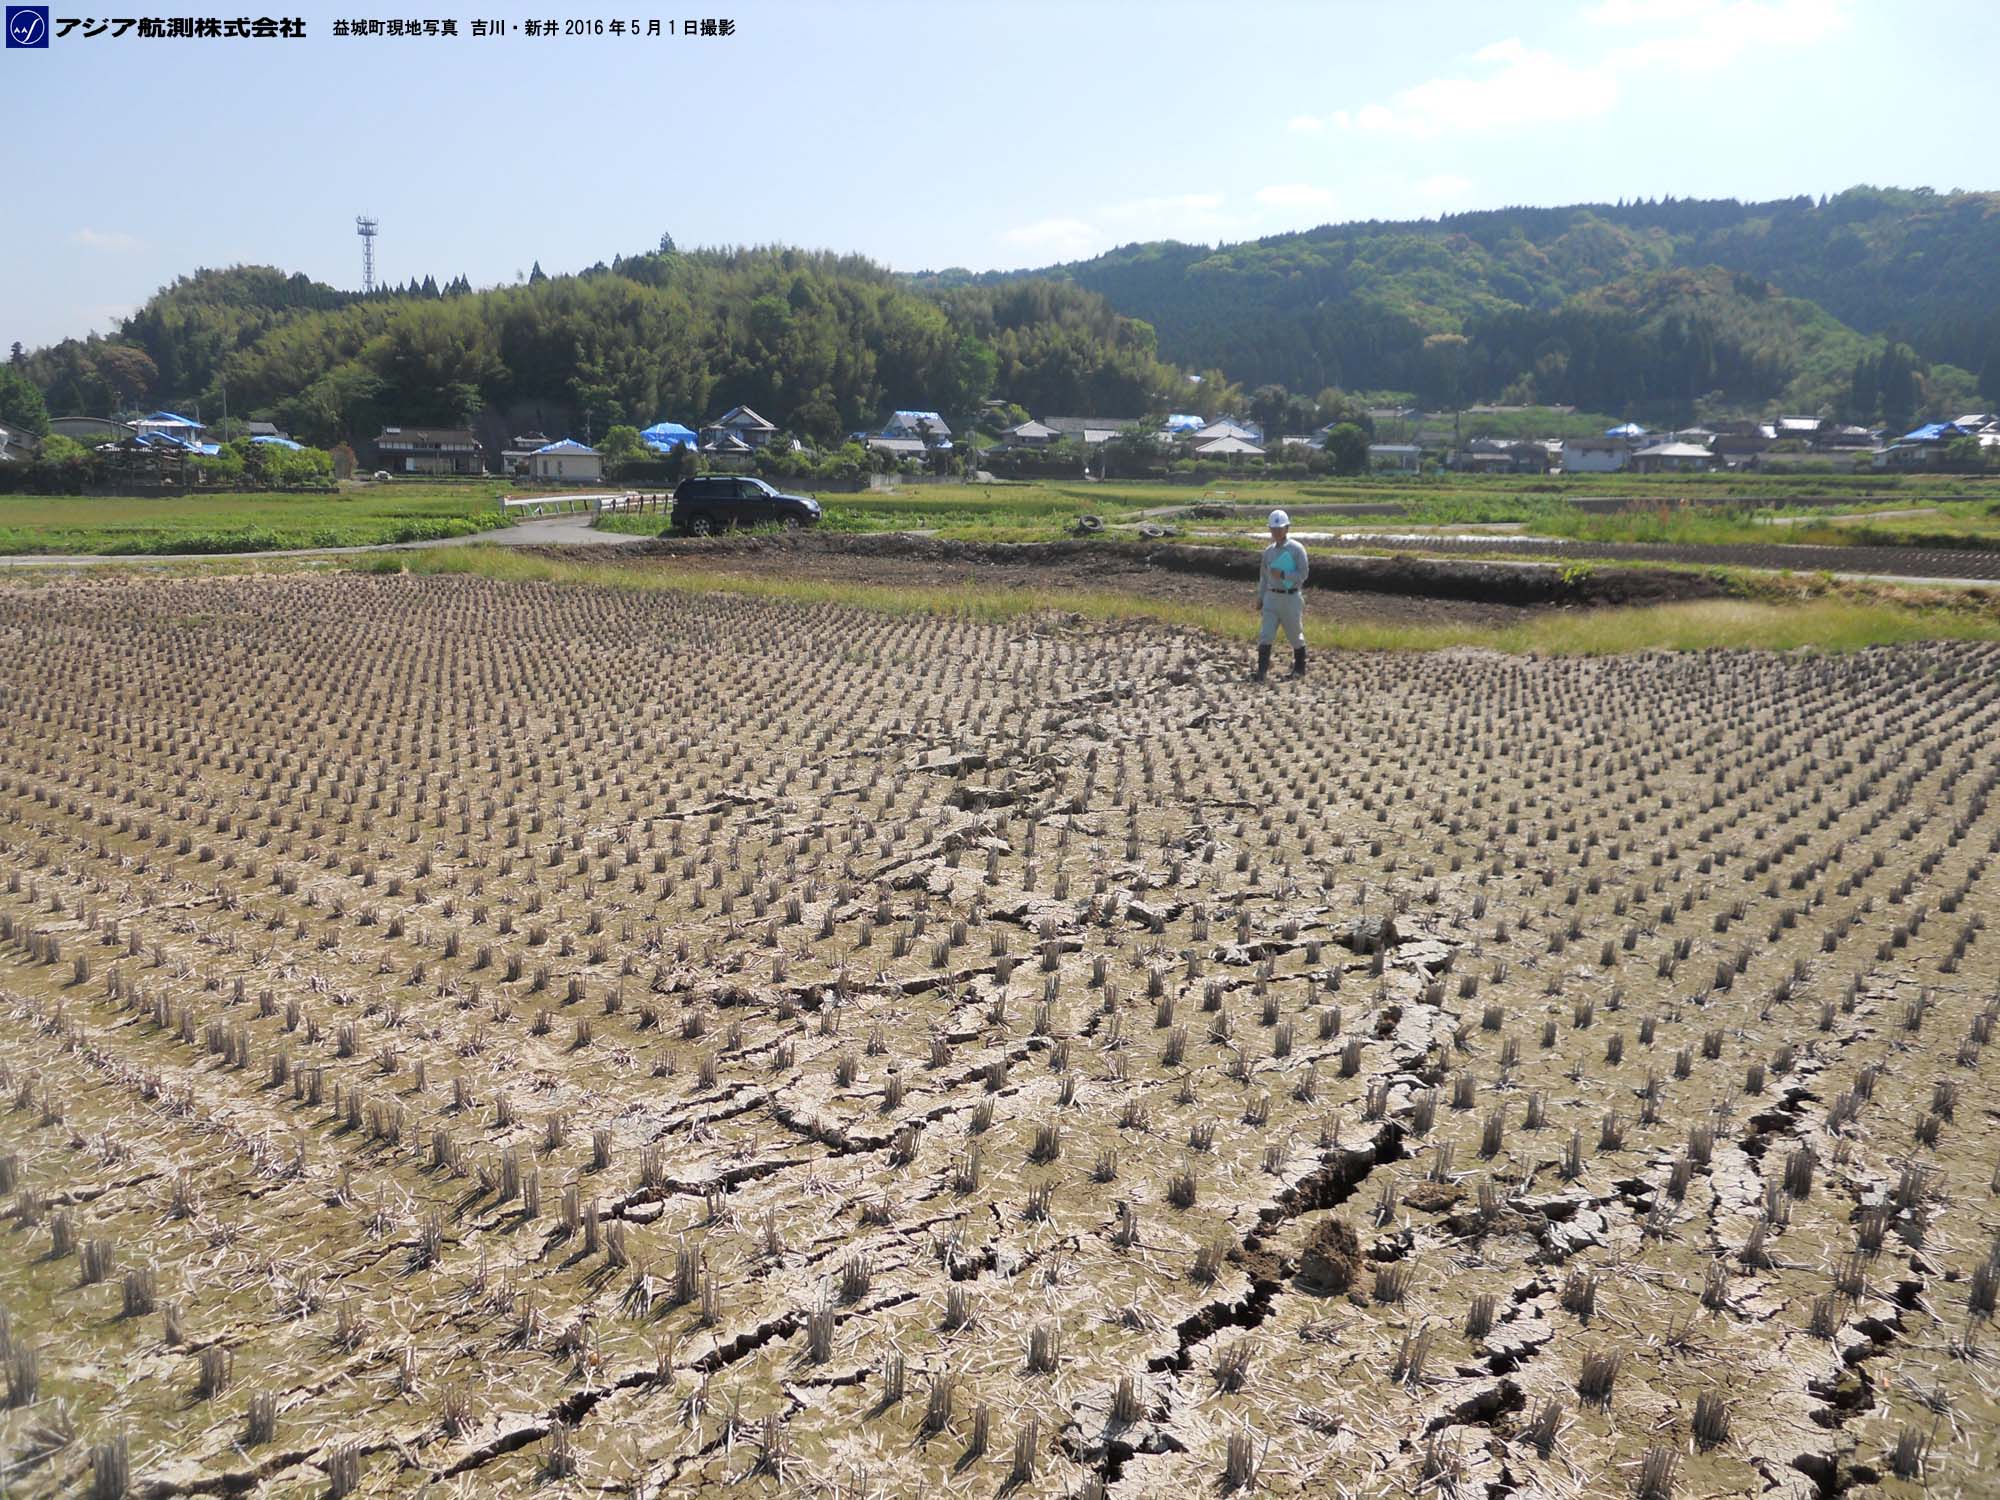
(f)Photo No.6683
The remained rice plants was displaced systematically to right along the line in the center of the photo (left-right line), while the front side was displaced to left, showing the right-lateral faulting. |
 |
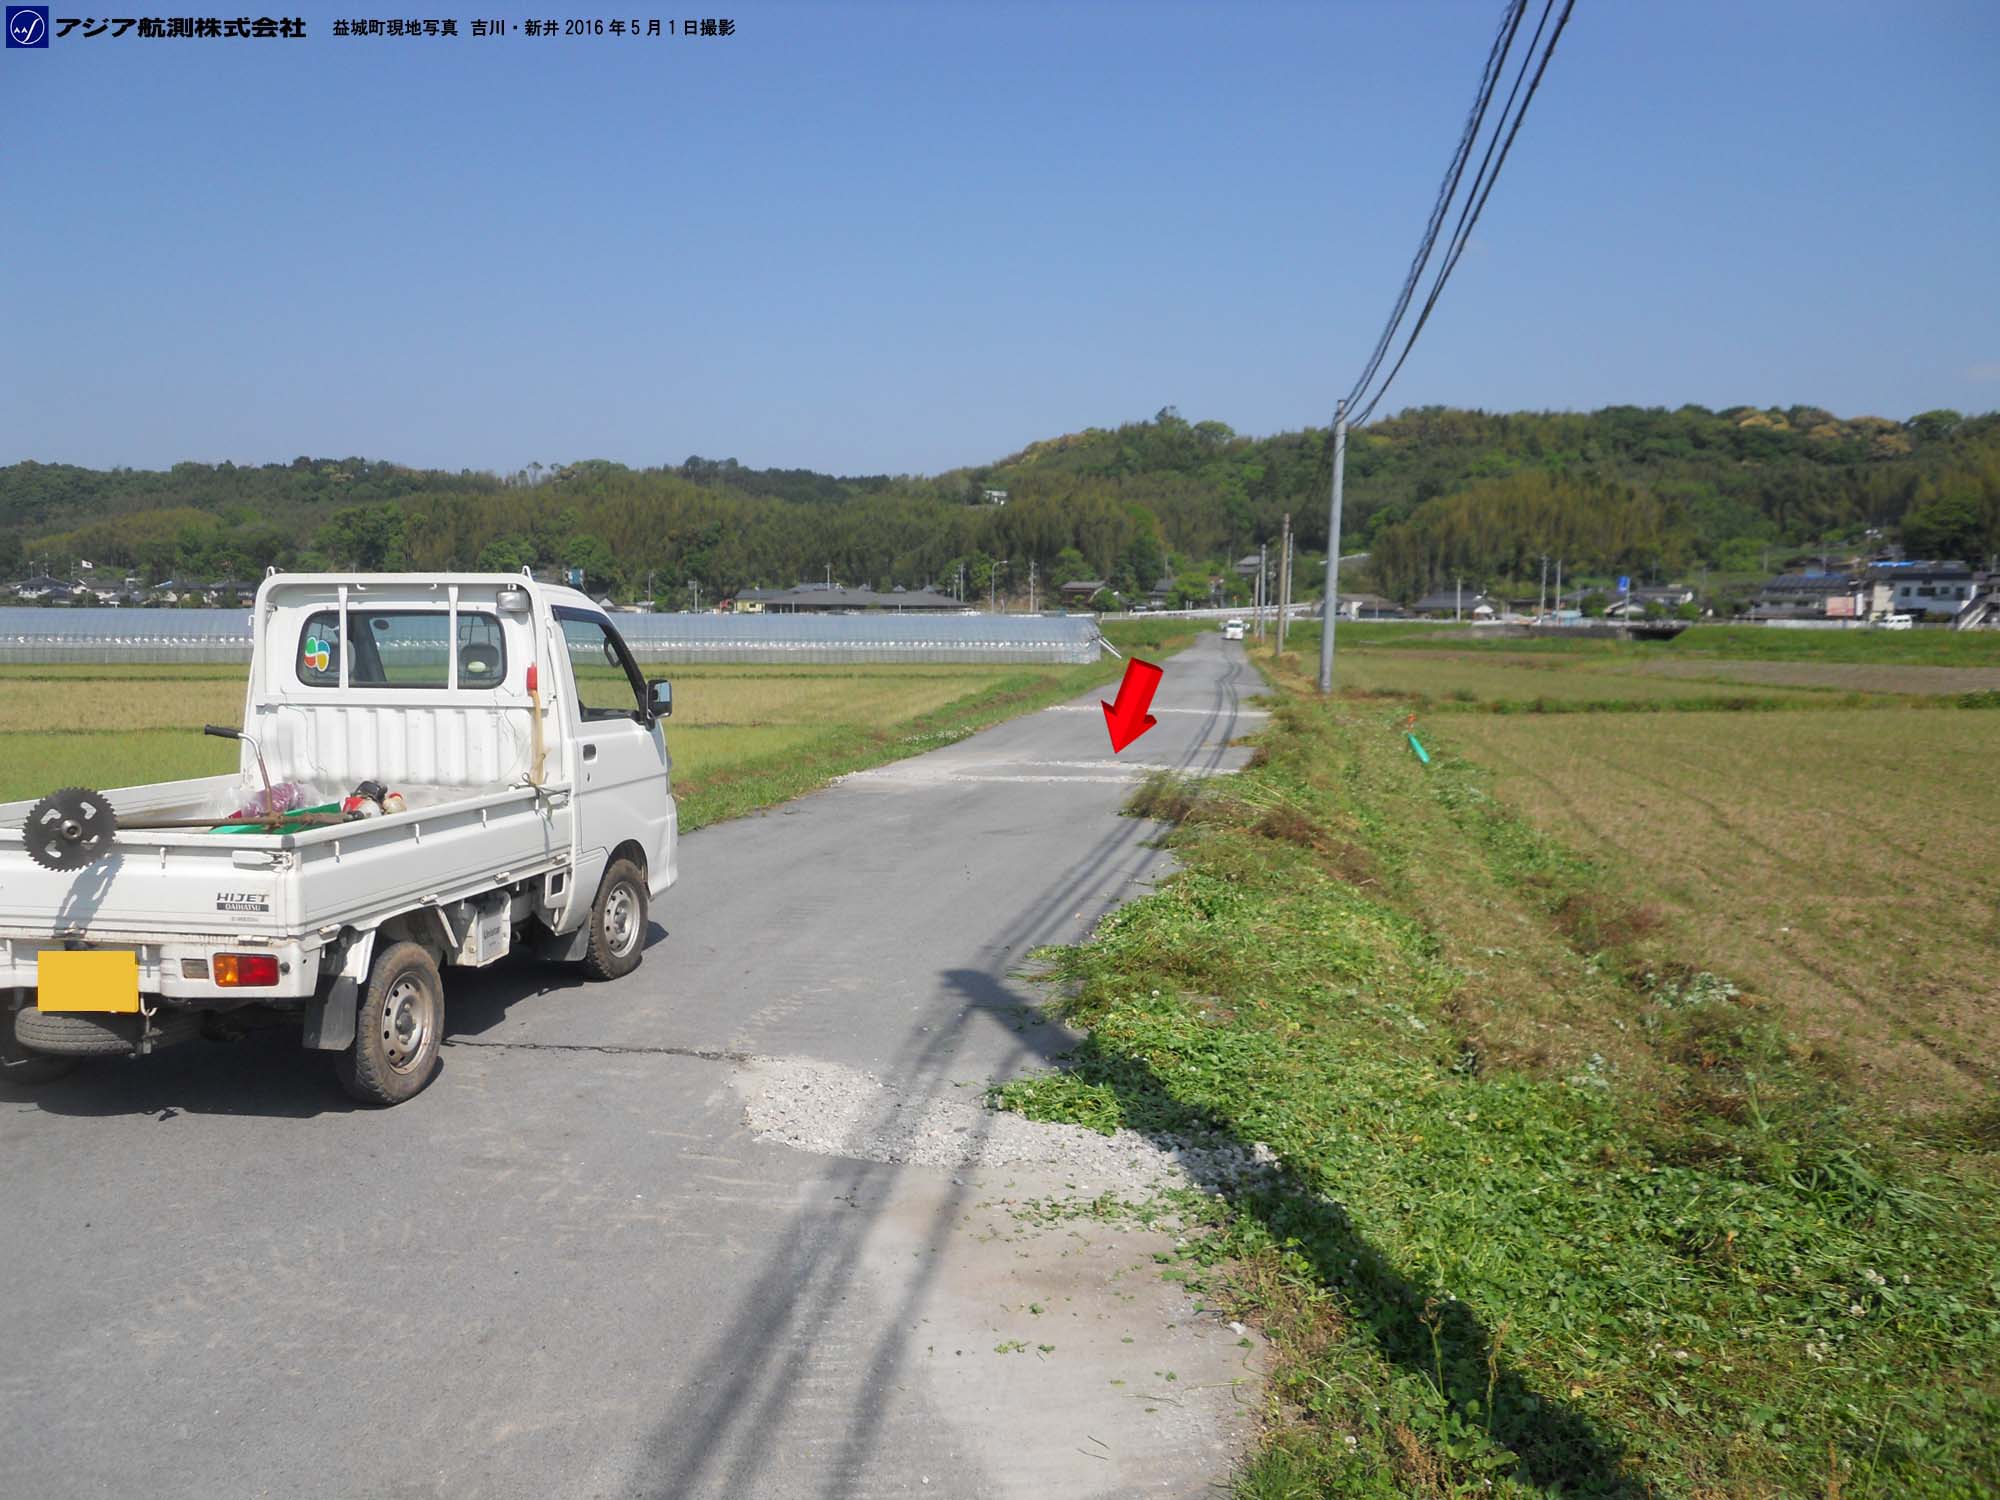
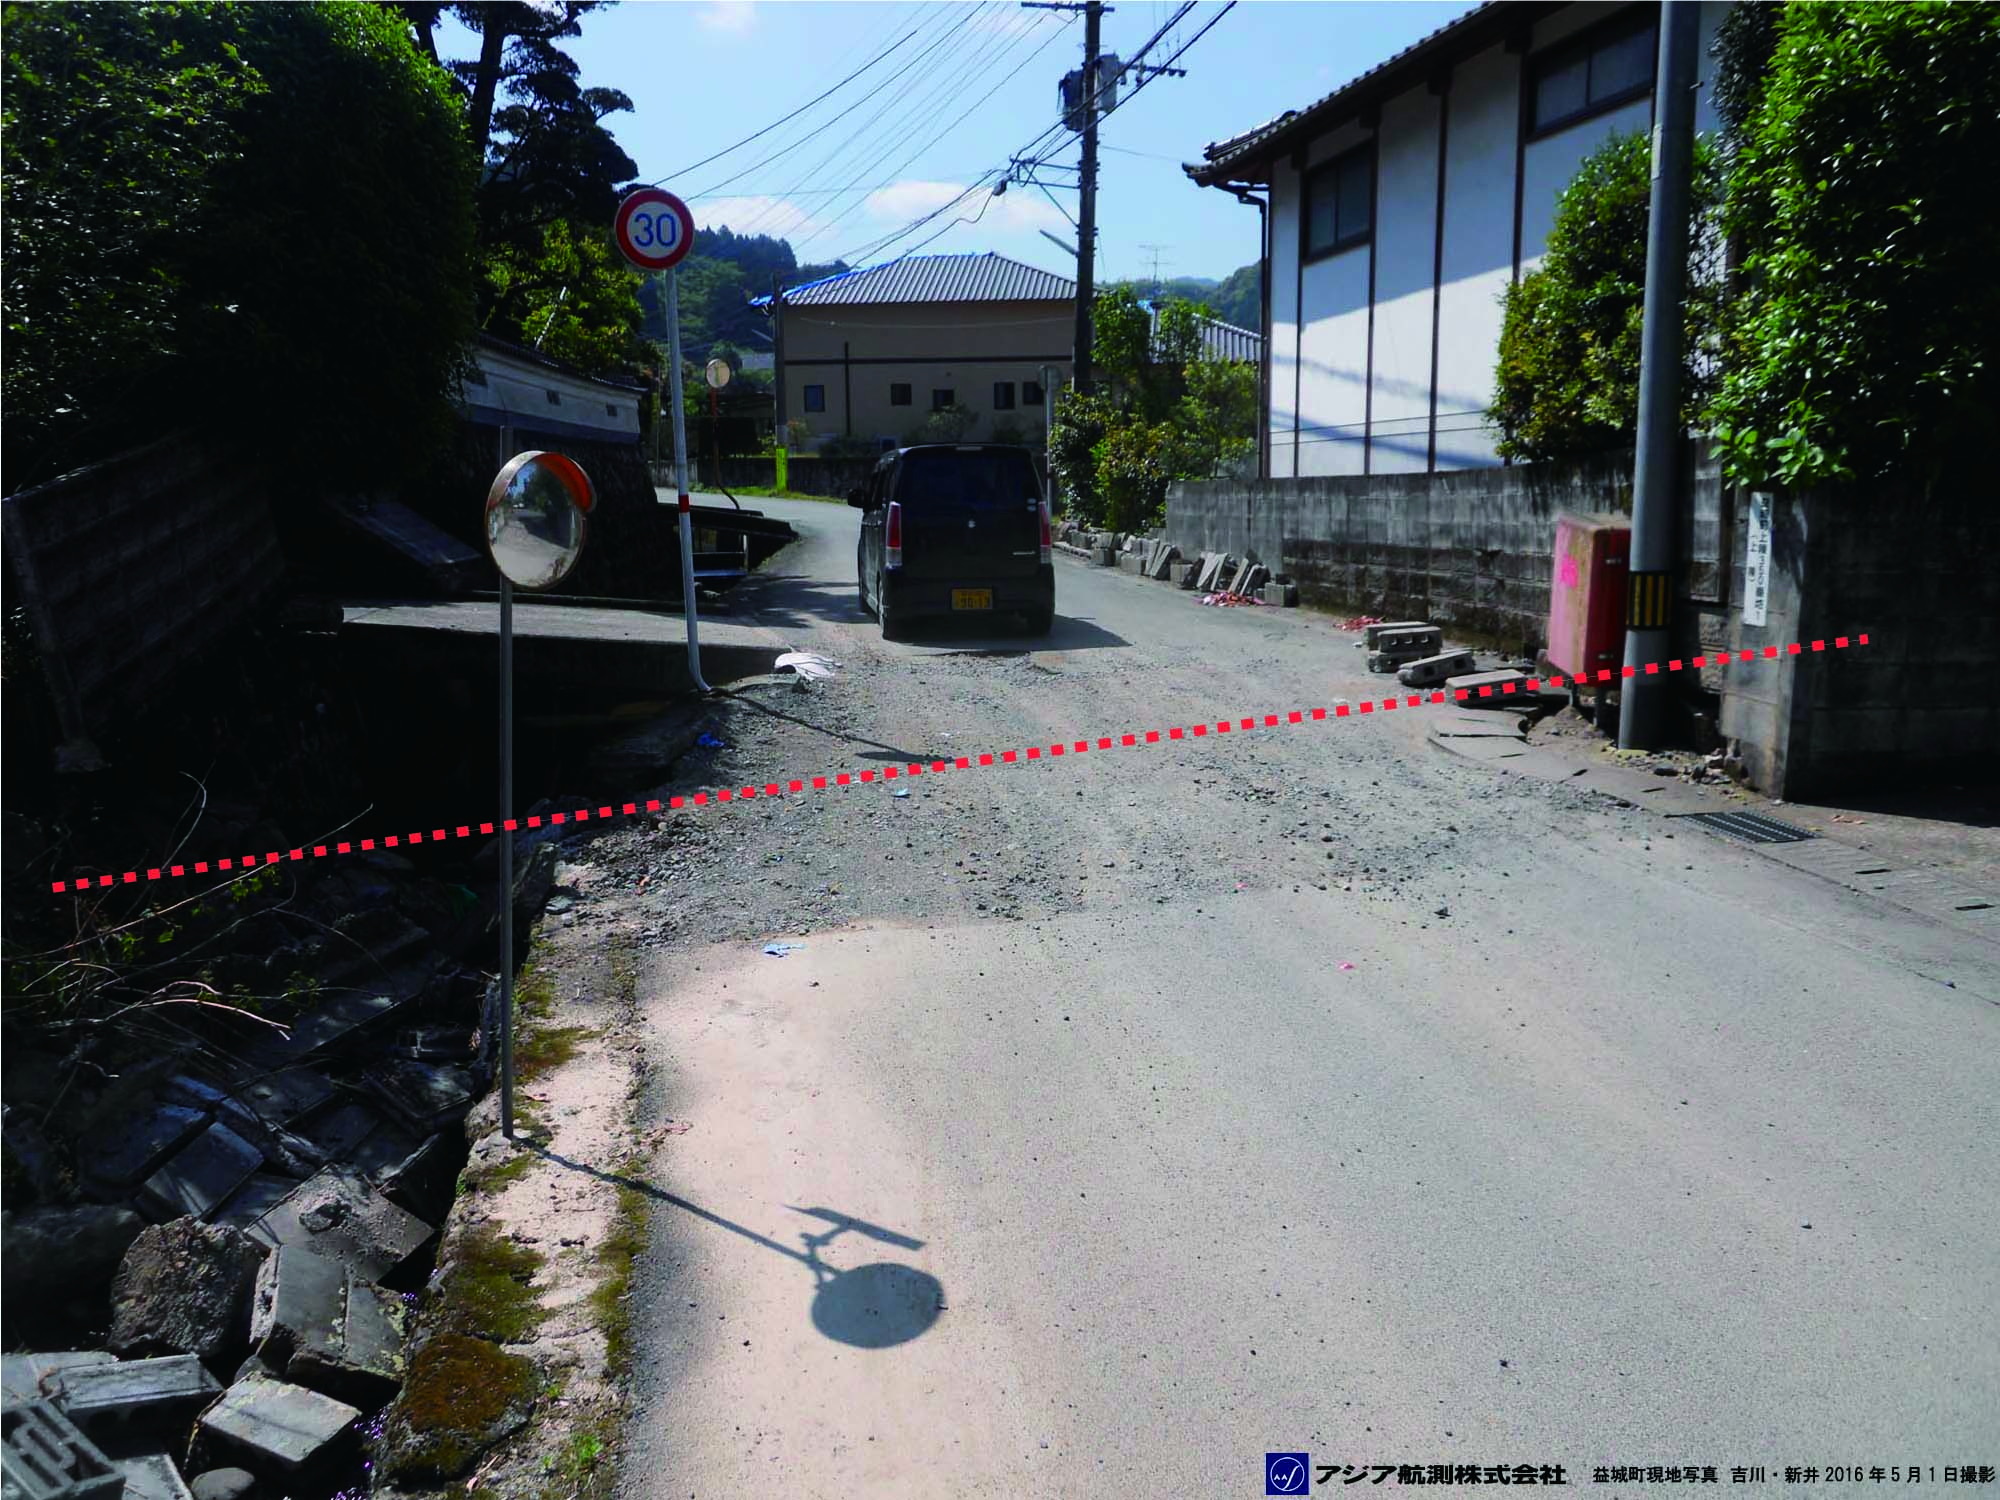
(h)Photo No.6678
The fault was recognized as right-lateral one based on the deformation of road and its guard rail due to the fault crossing the paved road. |
 |
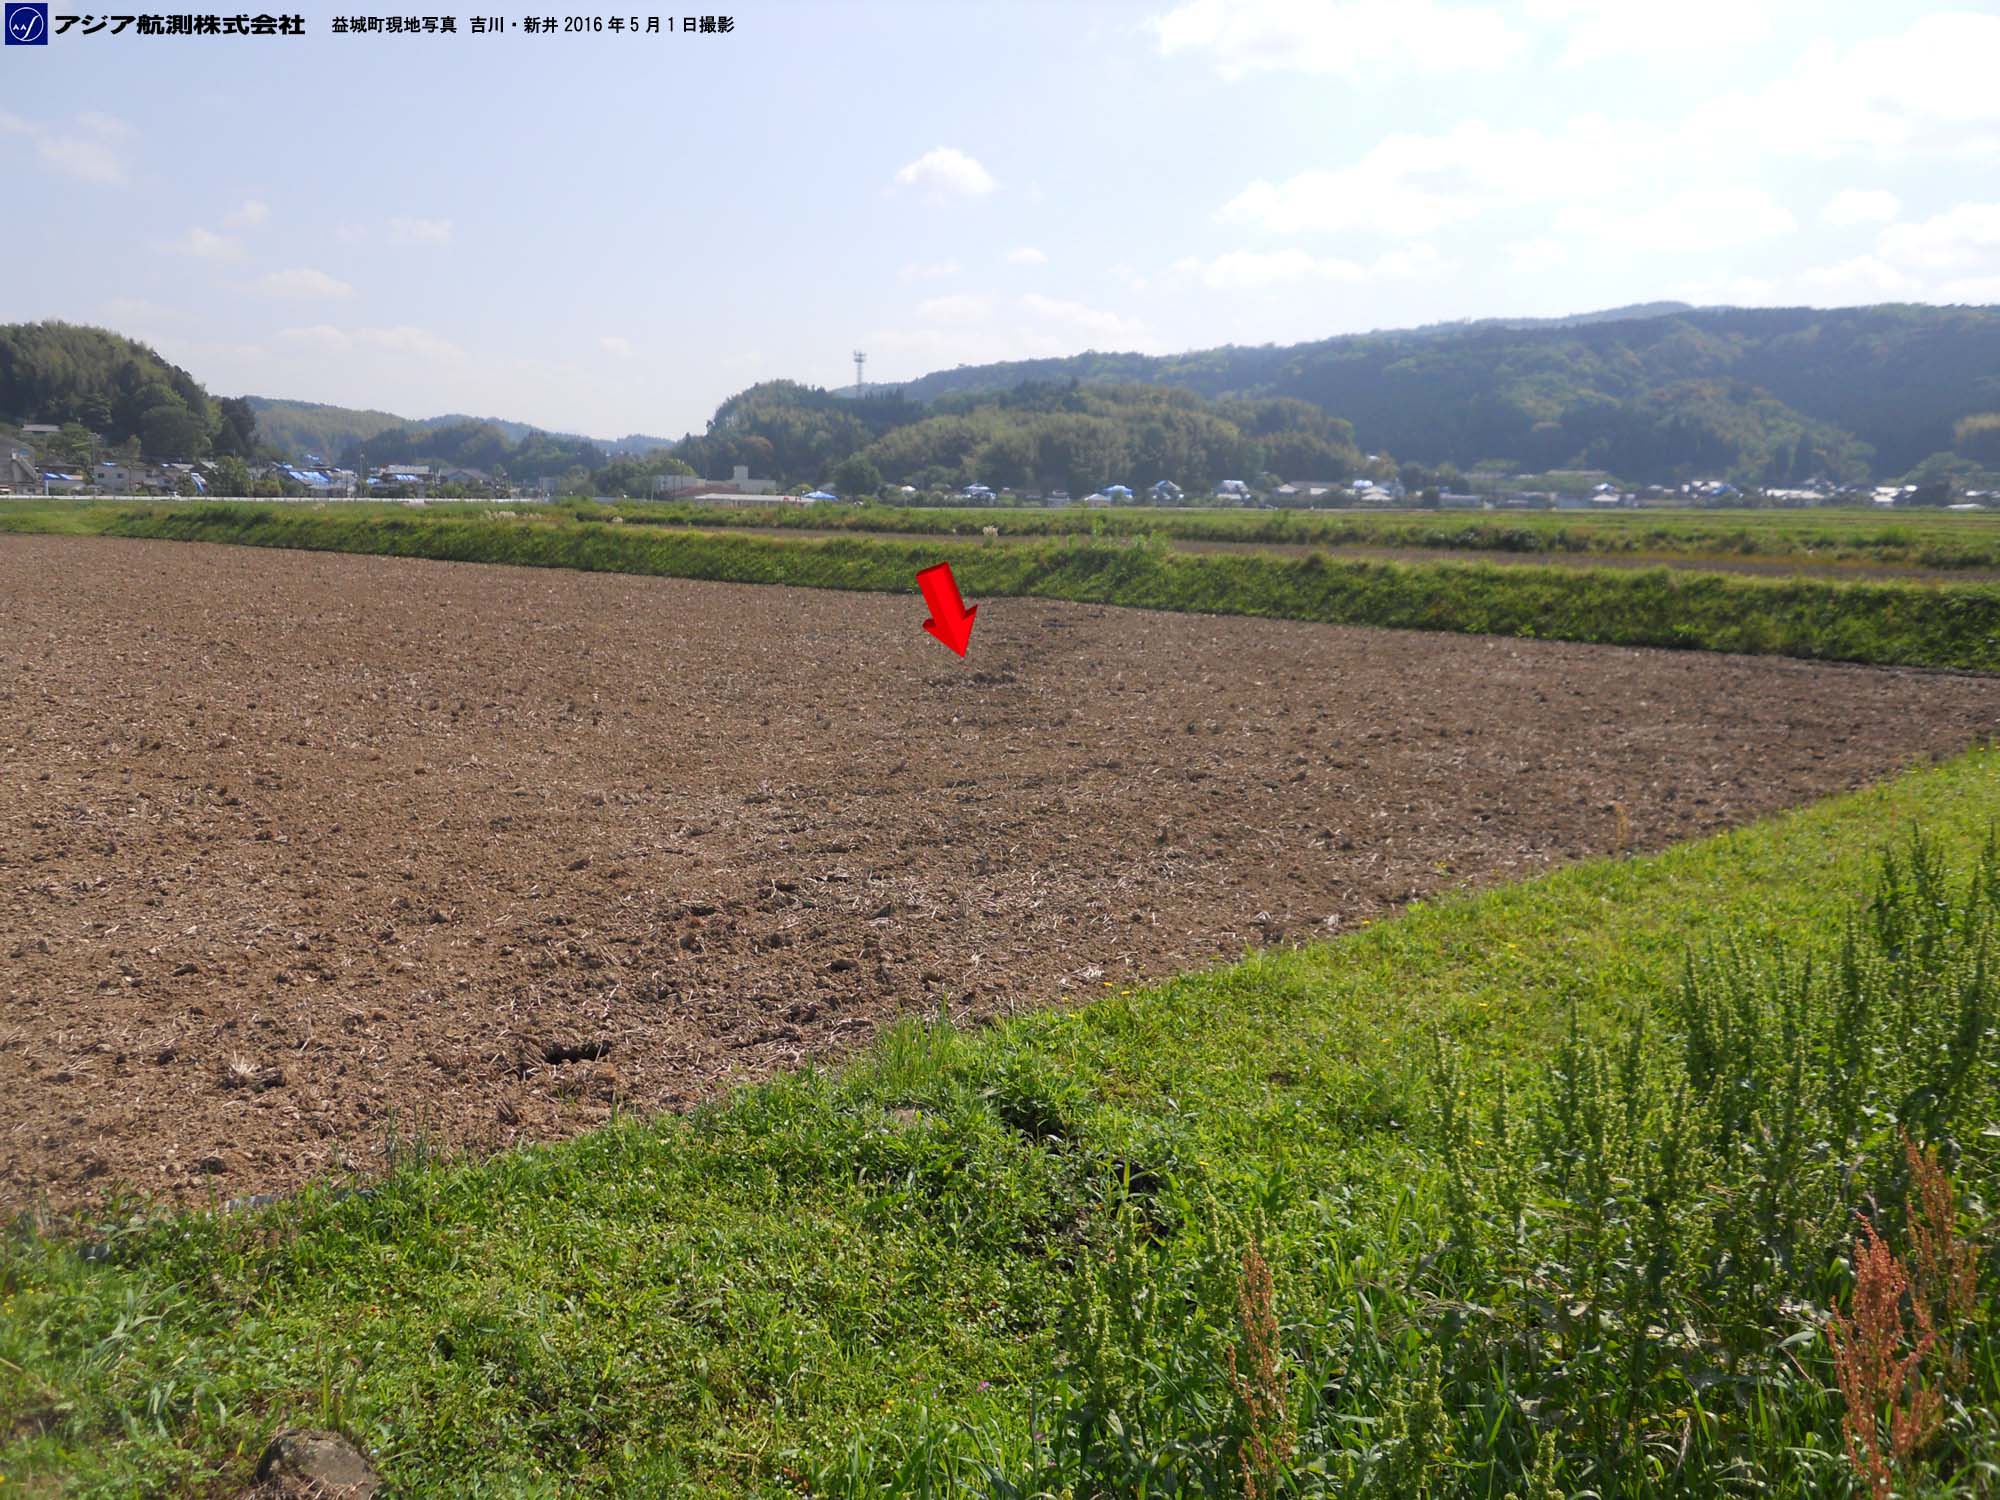
(j)Photo No.6702
Right-lateral displacement observed across road. |
 |
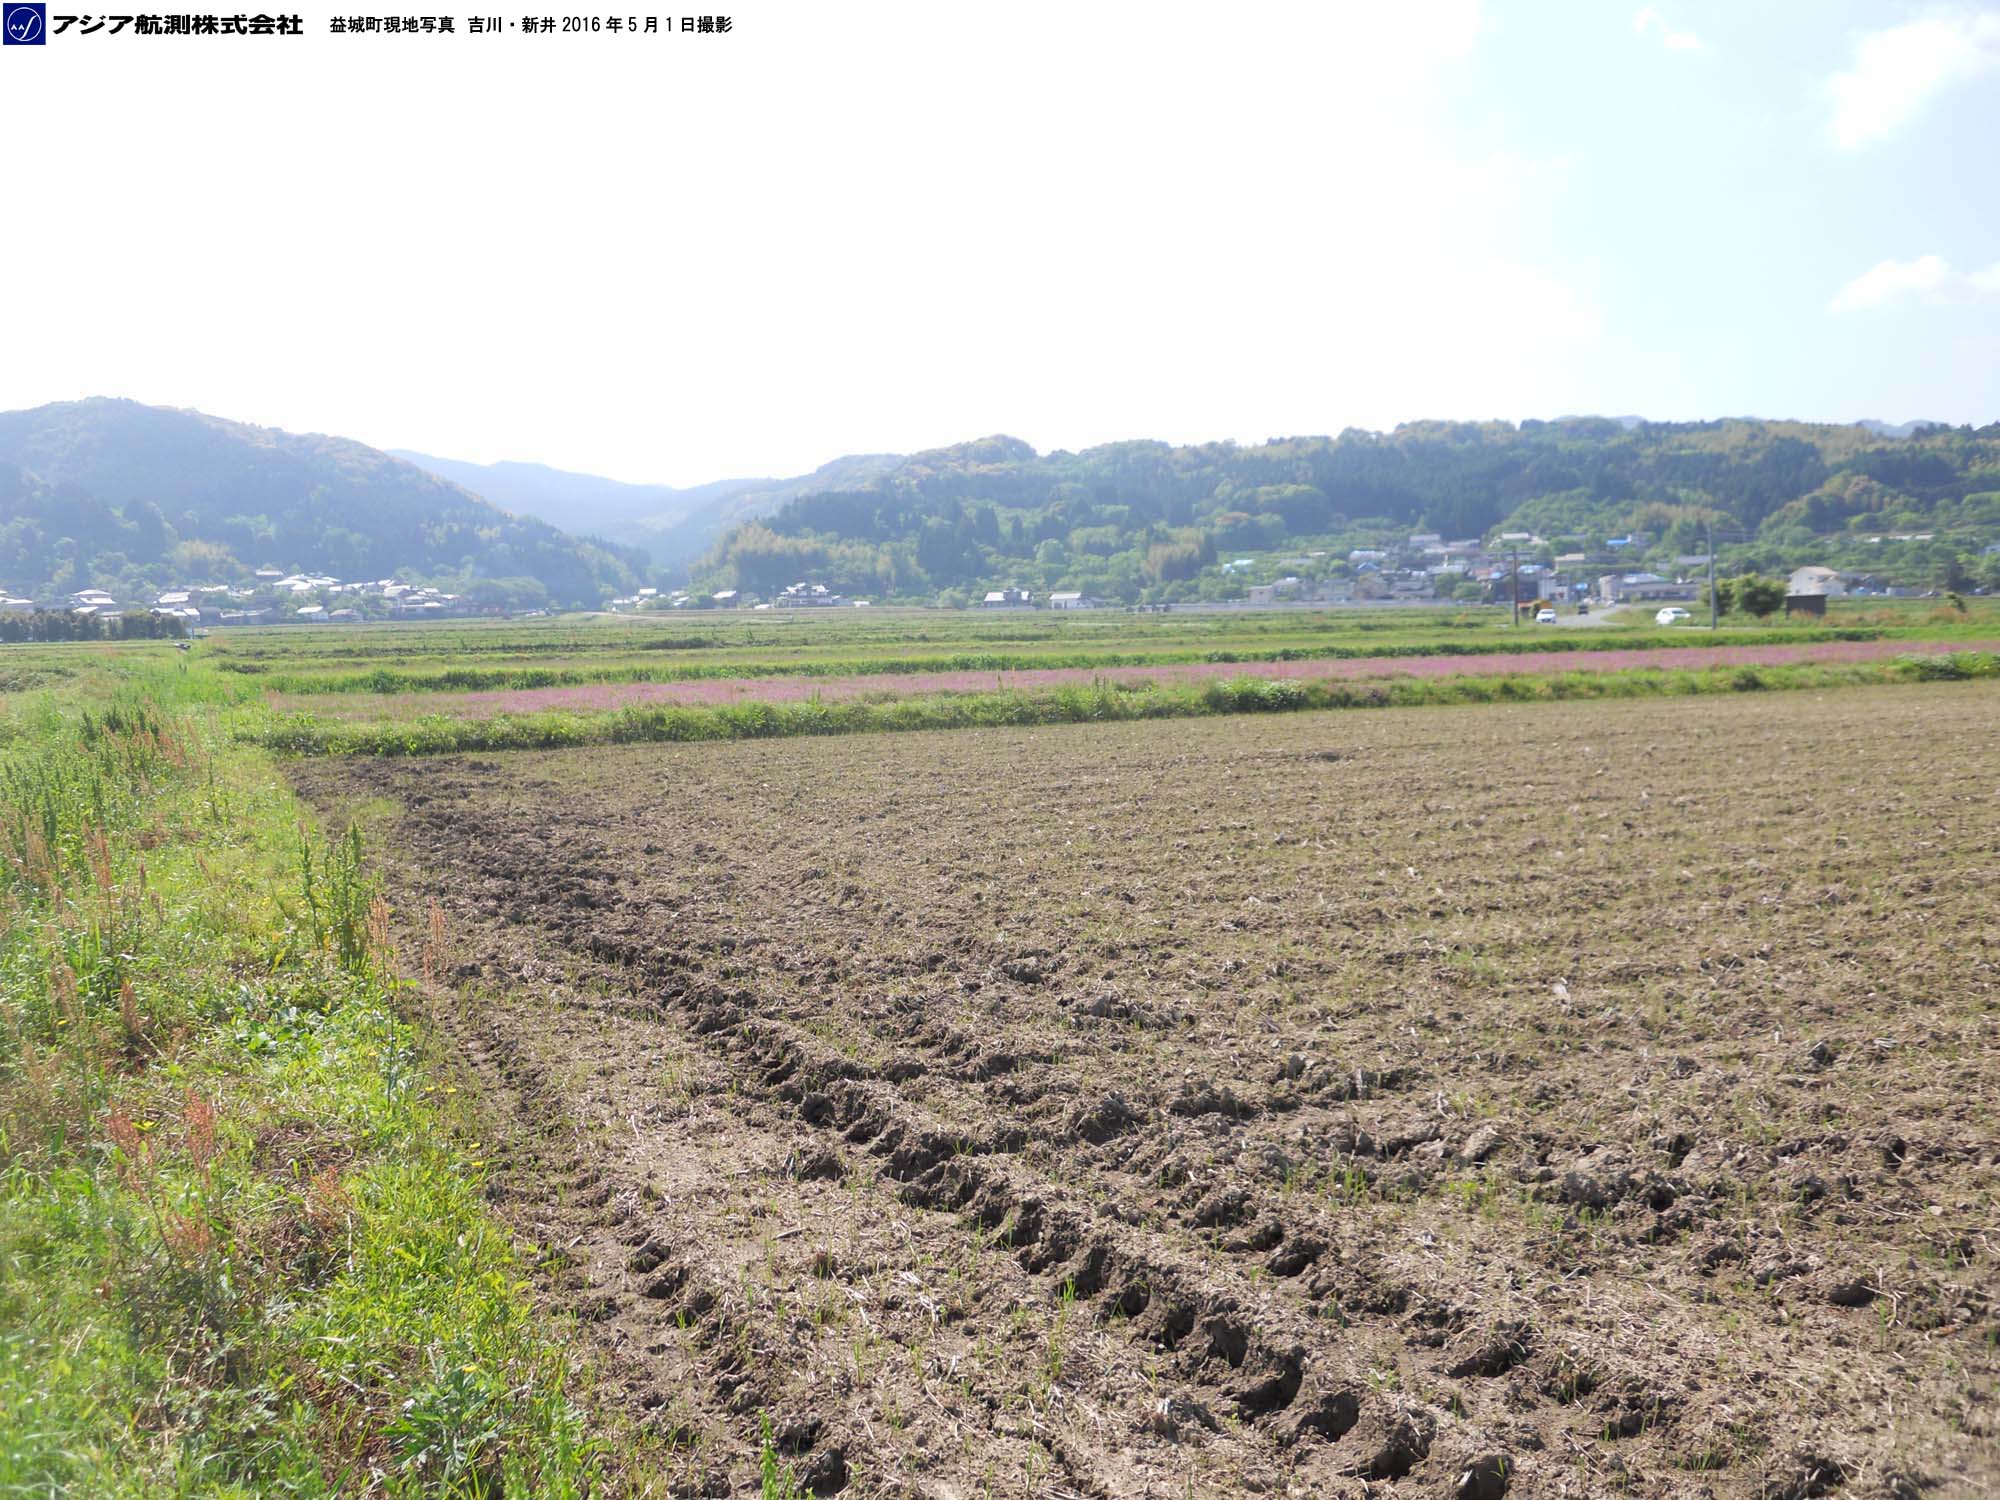
(k)Photo No.6700
The right side looking to photo is being higher. A series of left-stepping ruptures were appeared and showing the right-lateral faulting. |
 |
(l)Photo No.6701
A right-lateral fault was estimated according to en echelon ruptures. |
 |
(o)Photo No.6719
The waterway revetment was displaced right-laterally. The waterway revetment in the left side in the picture was destroyed seriously. |
 |
(p)Photo No.6705
Right-lateral displacement of vegetable and rice plants along the road. |
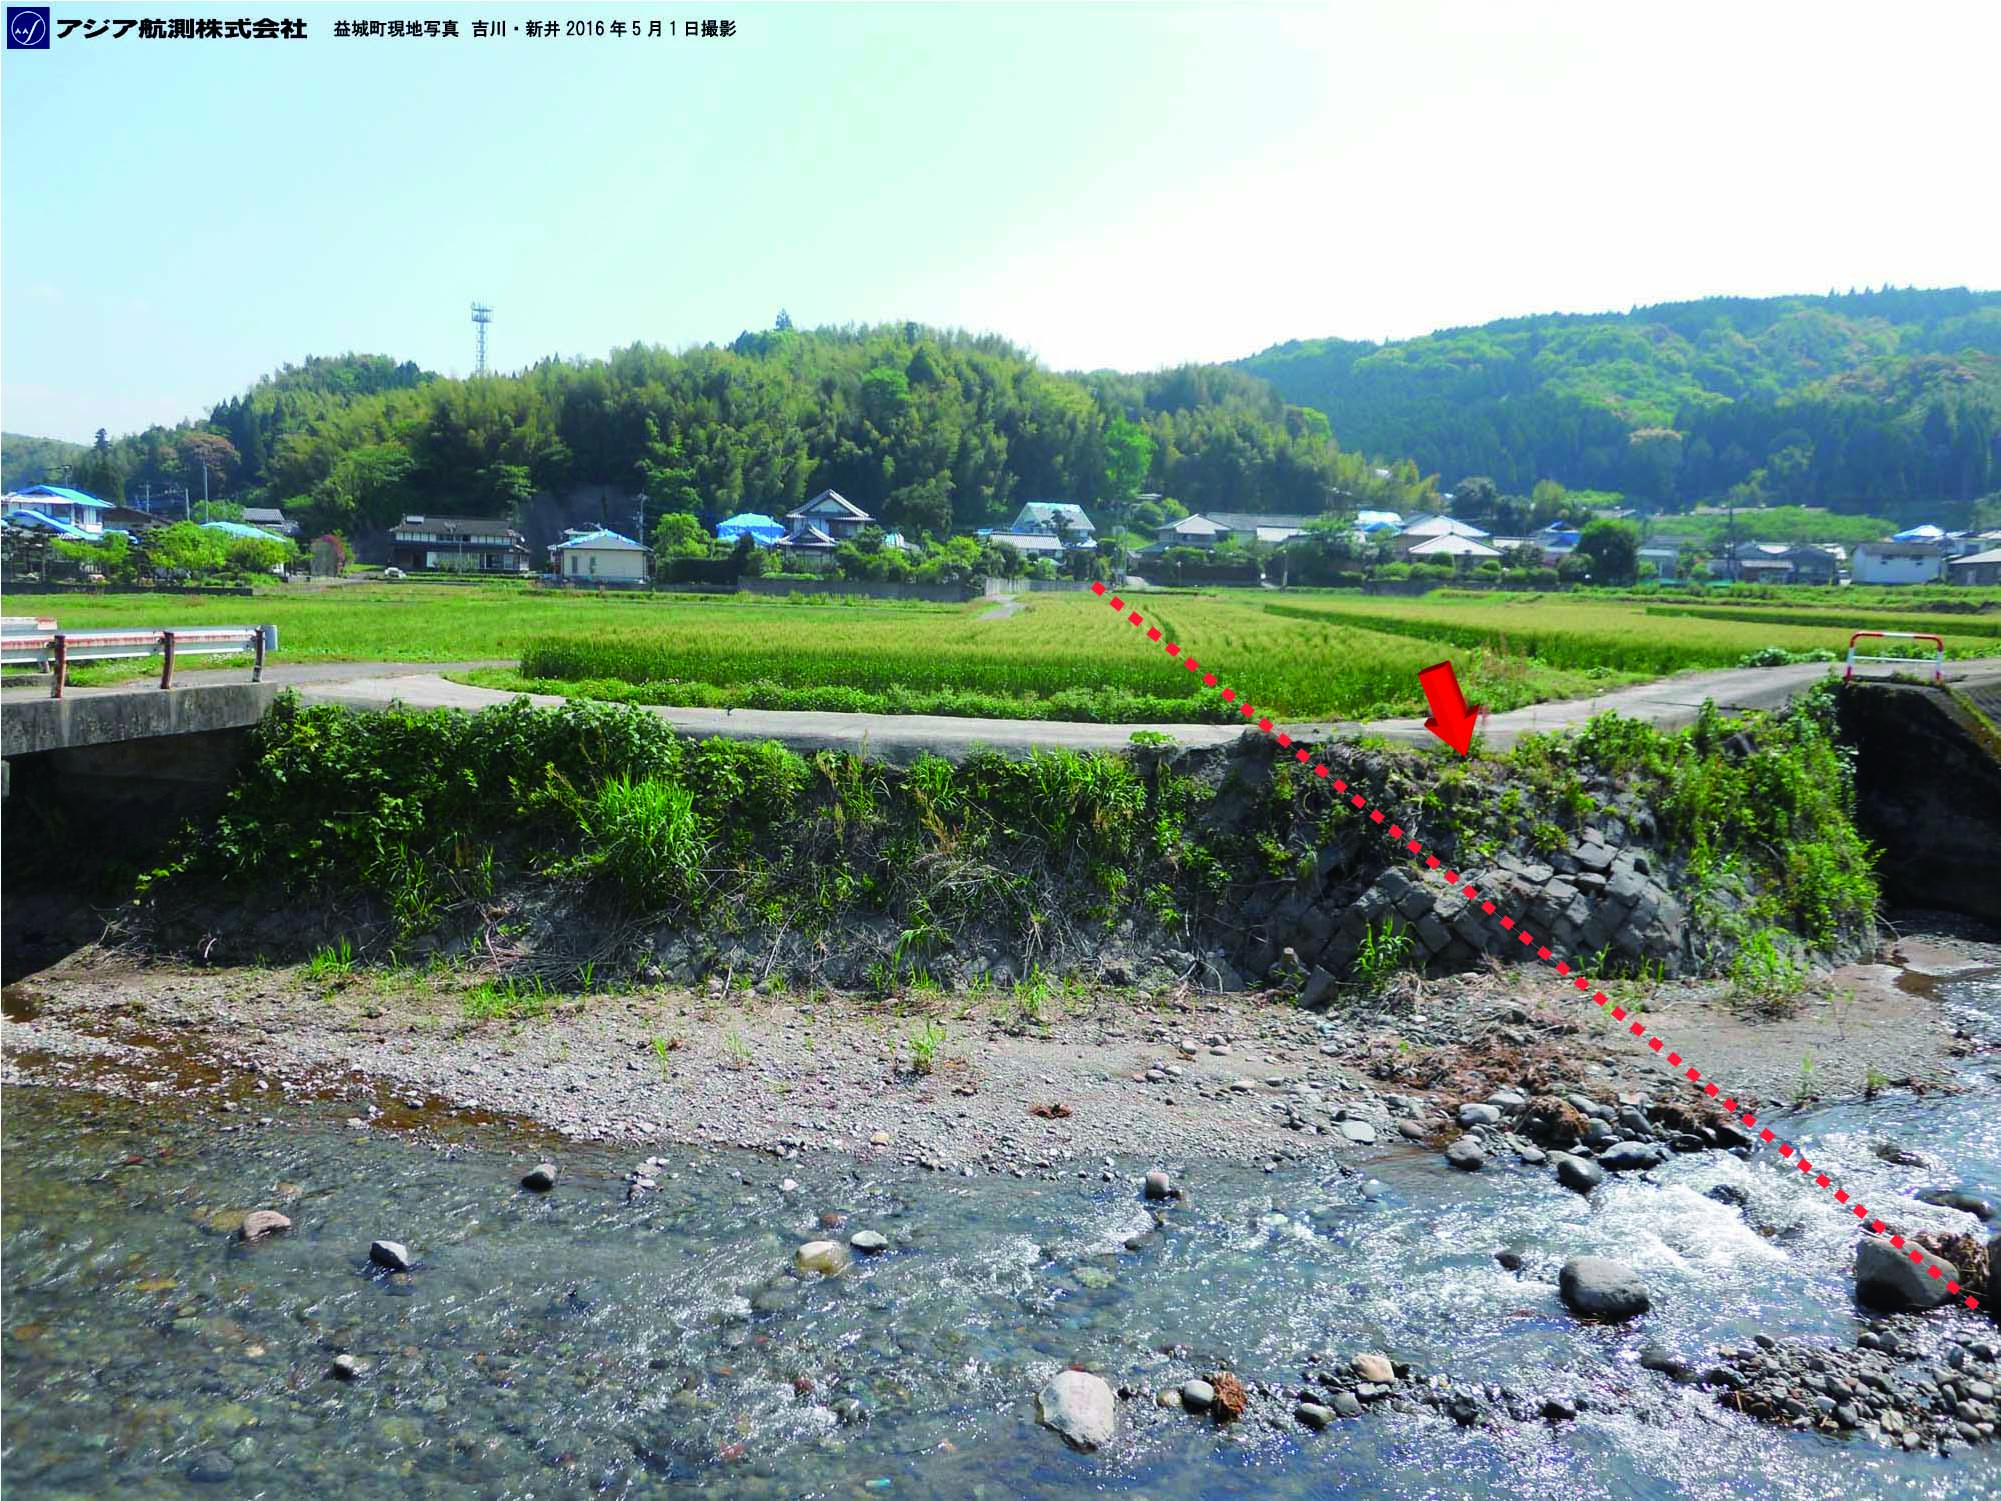 |
(q)Photo No.6707
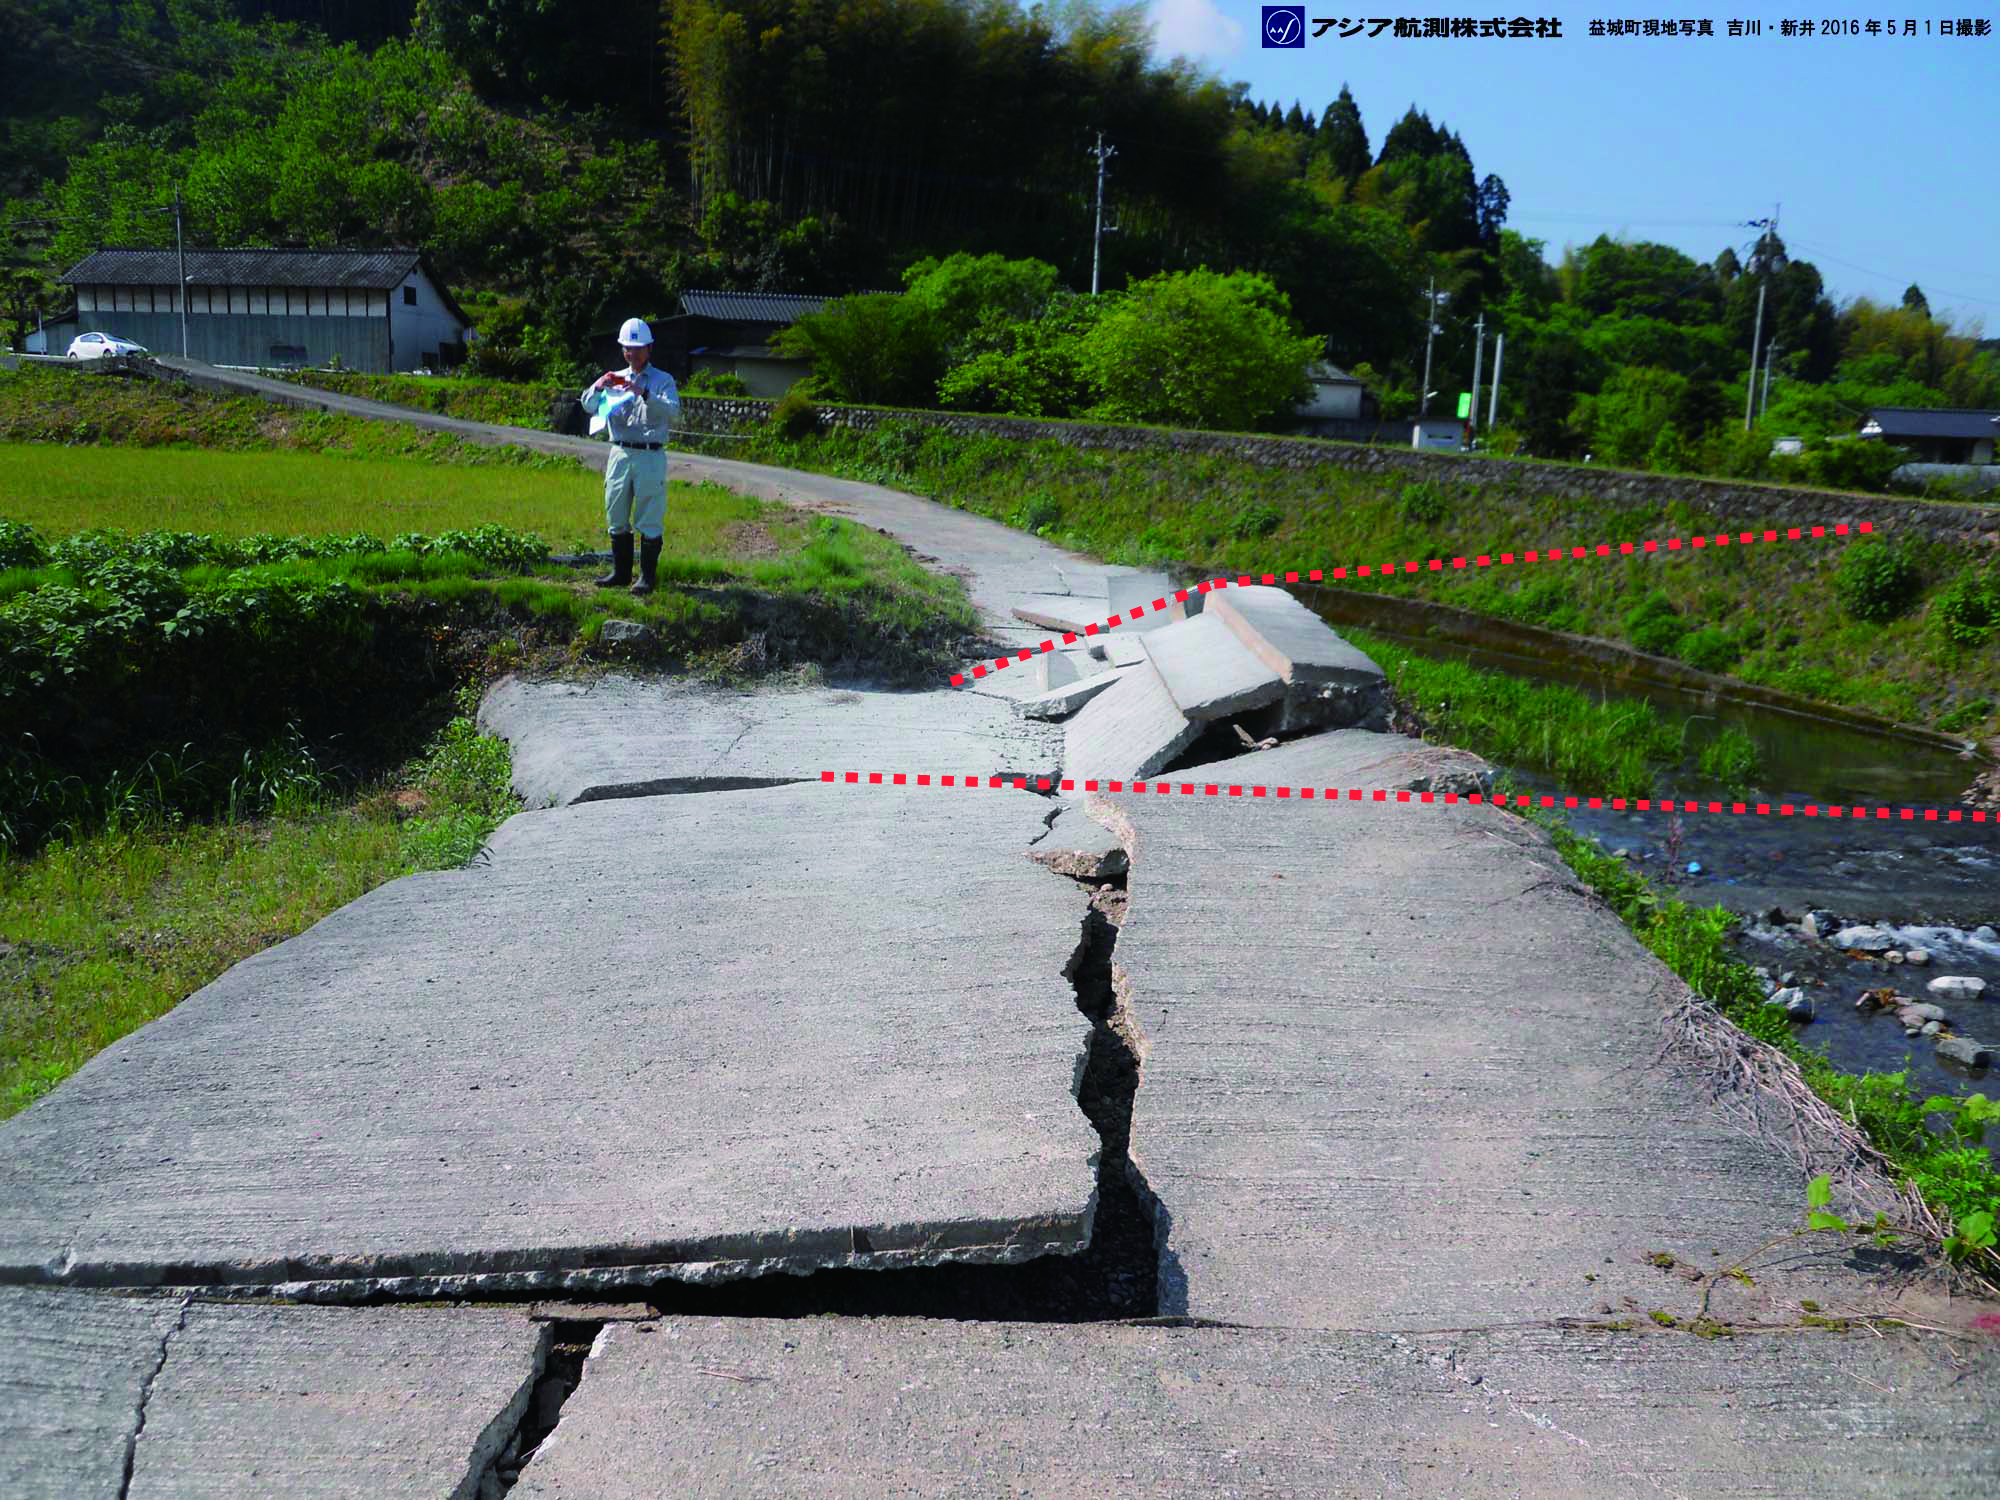
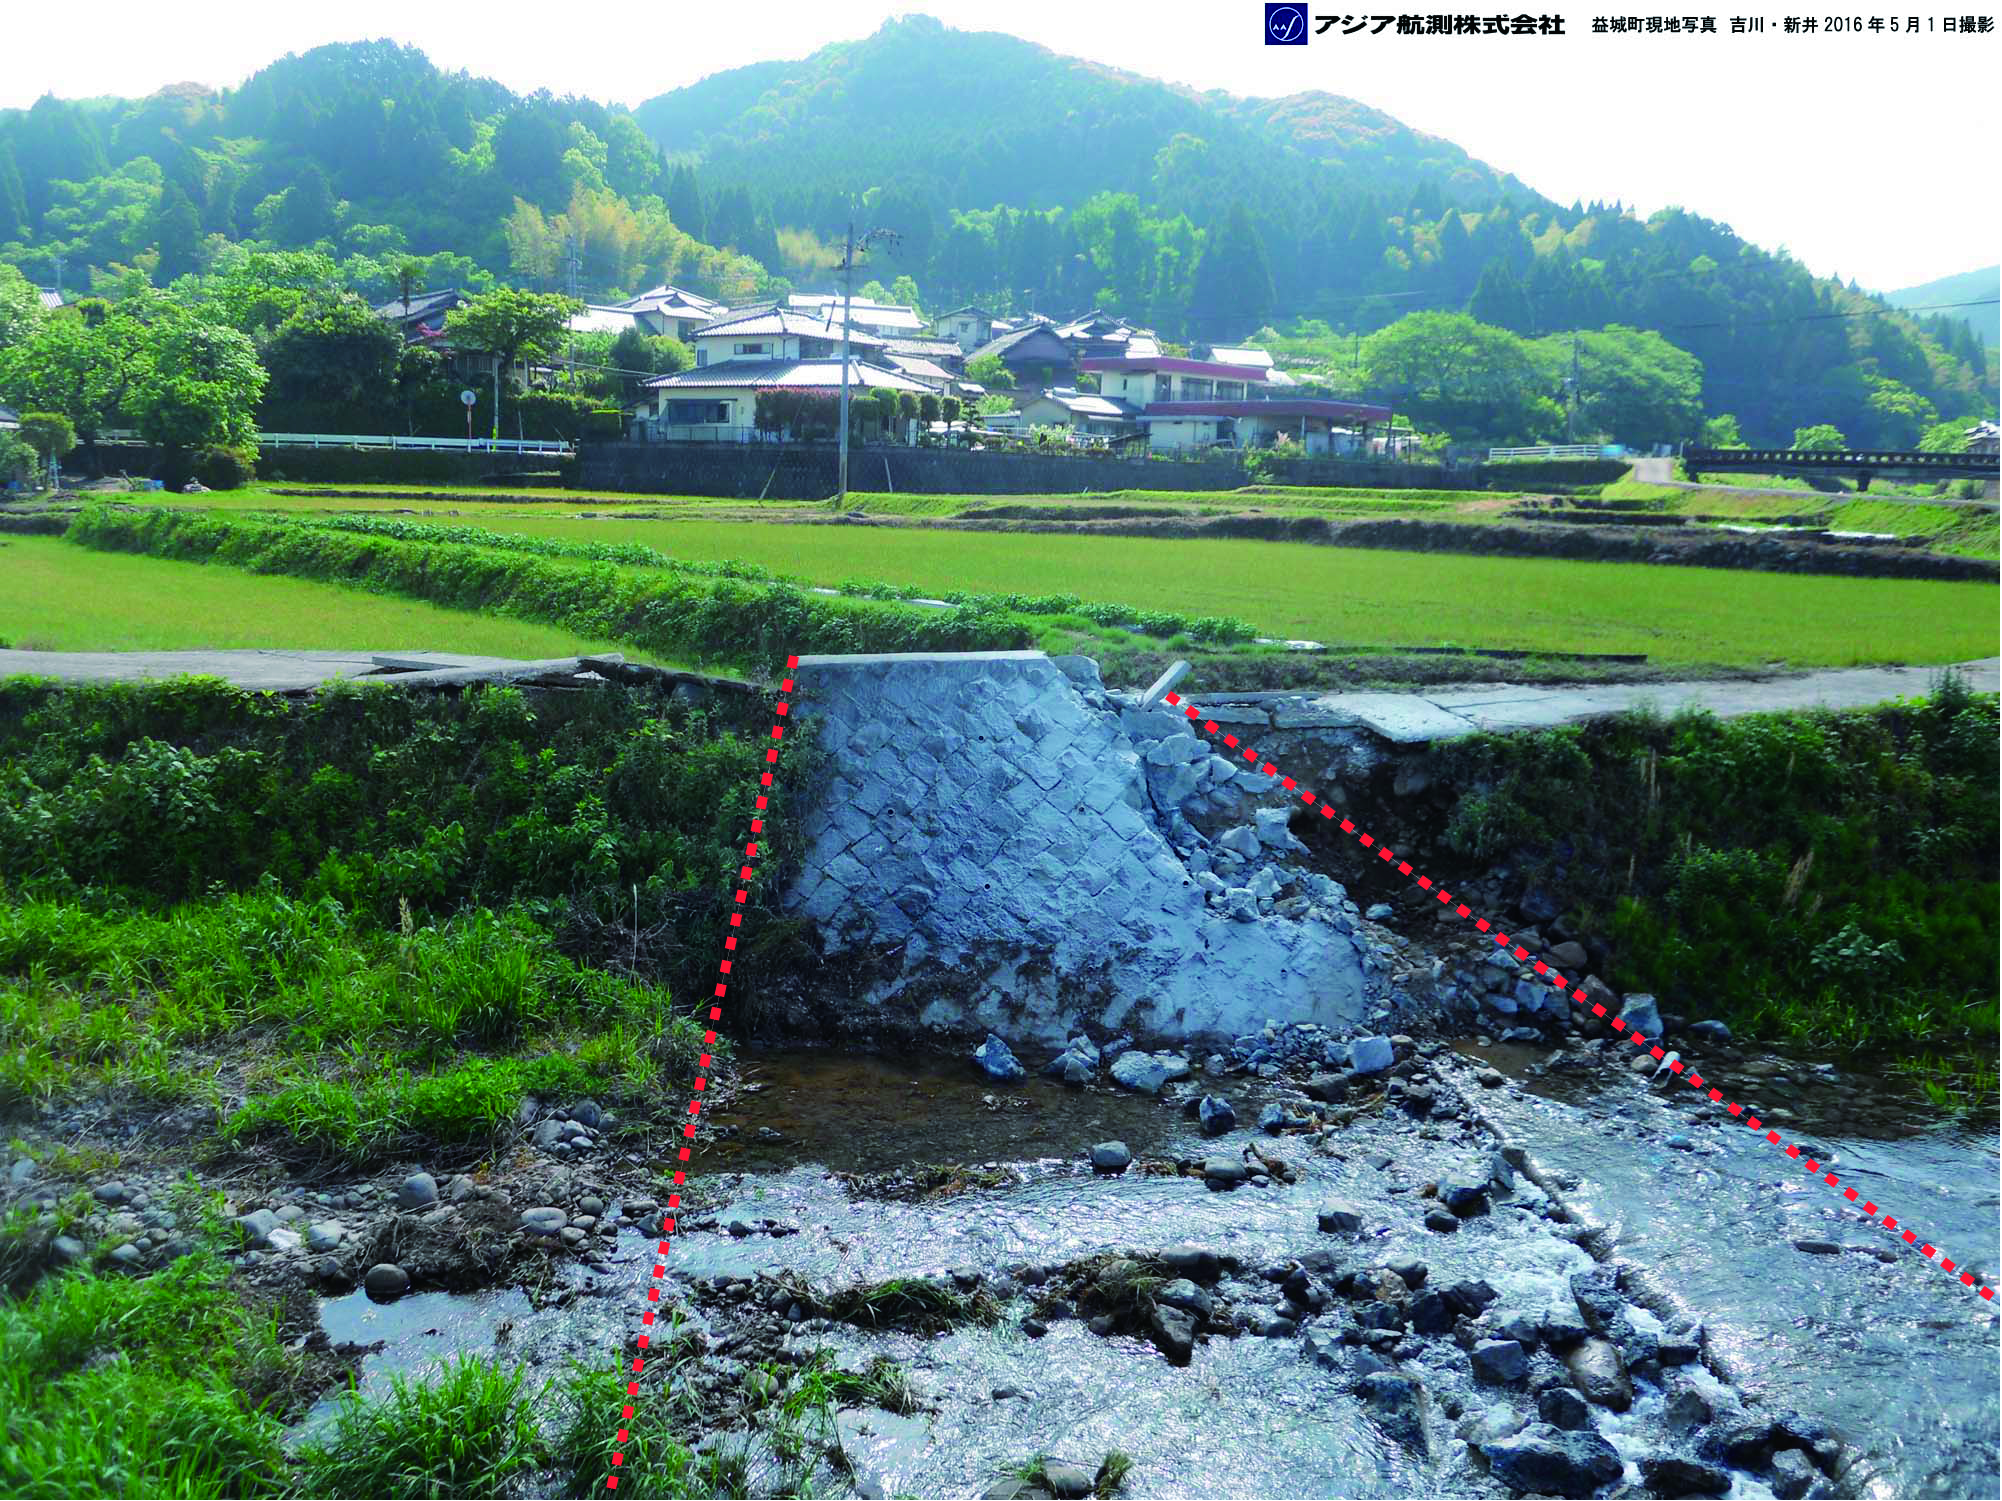
River revetment was seriously destroyed where the surface faulting occurred. |
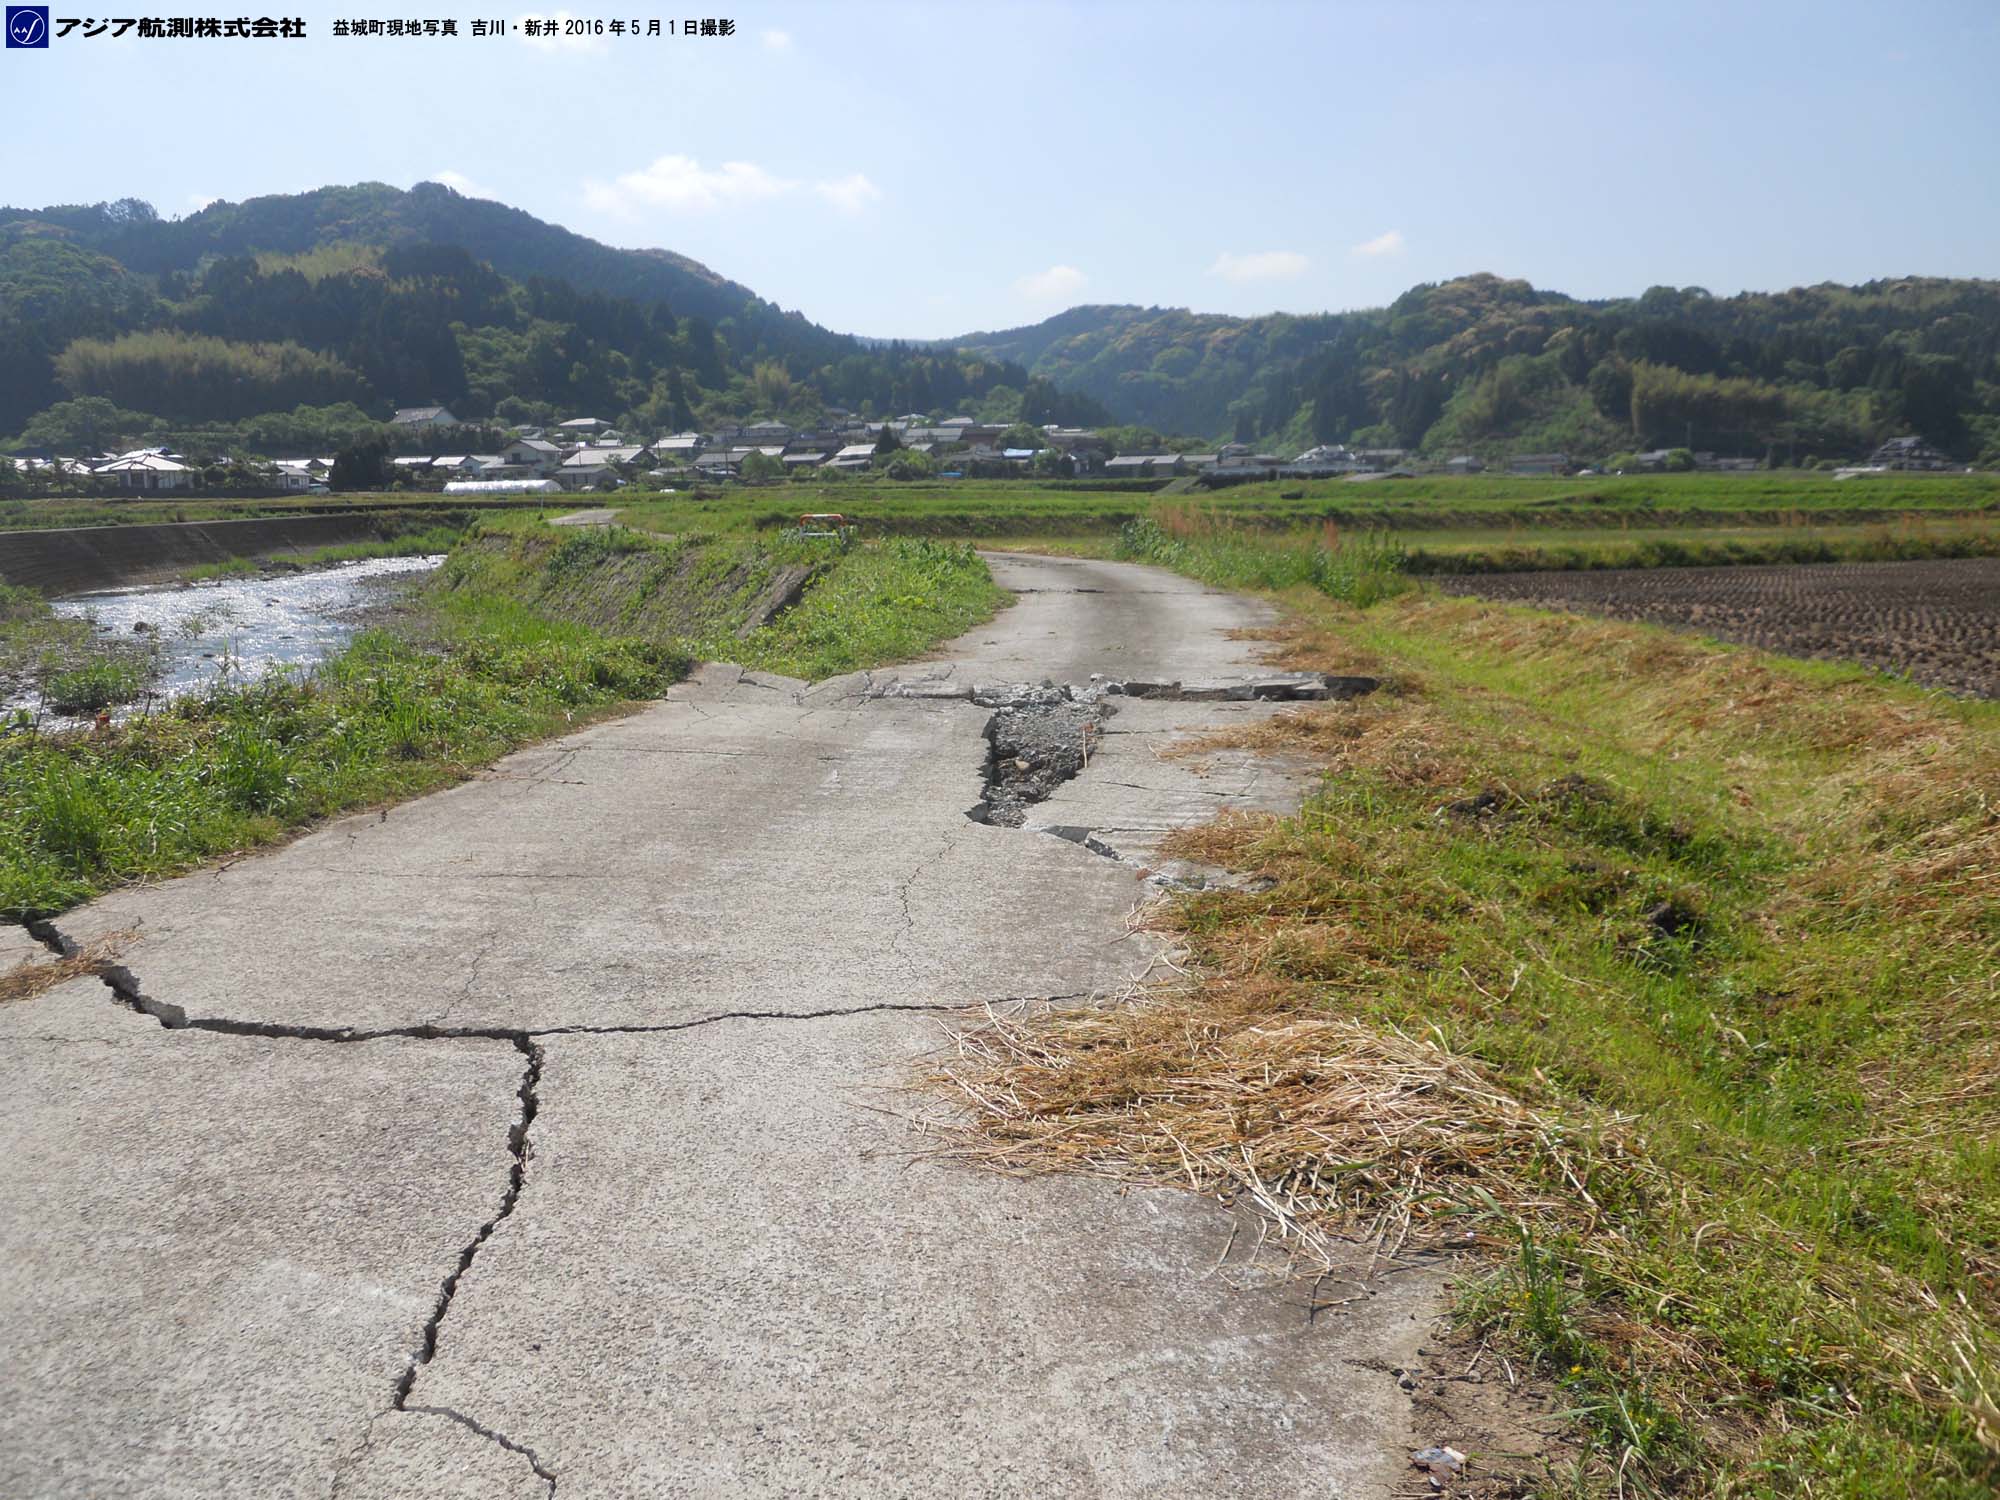 |
(r)Photo No.6708
The opposite side of photo (q), shows the damage of road in the left bank of the river. |
 |
(s)Photo No.6710
The fault clearly detected by the Lidar measurement of April 23. |
 |
(t)Photo No.6711
The fault clearly detected by the Lidar measurement of April 23. A series of left-stepping ruptures were appeared and showing the right-lateral faulting. |
| About this page |
|
関連リンク
関連ニュース
- 2023/02/09:2023年2月トルコ大地震震源地付近の赤色立体地図
- 2021/02/14:2021年2月13日発生の福島県沖地震被害状況
- 2018/09/07:「平成30年北海道胆振東部地震」被害状況(2018年9月6日)第一報
- 2016/04/28:「平成28年熊本地震」災害状況 第二報(2016年4月)
- 2016/04/15:「平成28年熊本地震」災害状況(2016年4月)
- 2014/11/25:「長野県神城断層地震」の被害状況
- 2010/05/07:「2010年中国青海省地震」赤色立体地図(2010年4月14日)
- 2000/07/05:「平成12年(2000年)神津島・新島地震」災害状況(2000年6月)